The critical path method (CPM), or critical path analysis (CPA), is an algorithm for scheduling a set of project activities. A critical path is determined by identifying the longest stretch of dependent activities and measuring the time required to complete them from start to finish. It is commonly used in conjunction with the program evaluation and review technique (PERT).

In mathematics, particularly graph theory, and computer science, a directed acyclic graph (DAG) is a directed graph with no directed cycles. That is, it consists of vertices and edges, with each edge directed from one vertex to another, such that following those directions will never form a closed loop. A directed graph is a DAG if and only if it can be topologically ordered, by arranging the vertices as a linear ordering that is consistent with all edge directions. DAGs have numerous scientific and computational applications, ranging from biology to information science to computation (scheduling).

August-Wilhelm Scheer is a German Professor of business administration and business information at Saarland University, and founder and director of IDS Scheer AG, a major IT service and software company. He is known for the development of the Architecture of Integrated Information Systems (ARIS) concept.

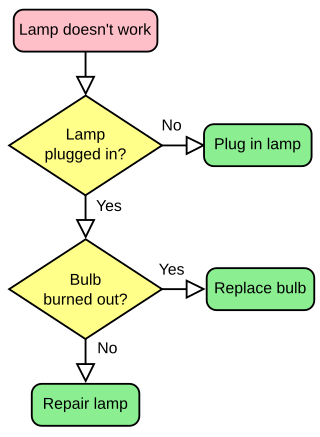
A flowchart is a type of diagram that represents a workflow or process. A flowchart can also be defined as a diagrammatic representation of an algorithm, a step-by-step approach to solving a task.

In analog telephony, a telephone hybrid is the component at the ends of a subscriber line of the public switched telephone network (PSTN) that converts between two-wire and four-wire forms of bidirectional audio paths. When used in broadcast facilities to enable the airing of telephone callers, the broadcast-quality telephone hybrid is known as a broadcast telephone hybrid or telephone balance unit.
GSM services are a standard collection of applications and features available over the Global System for Mobile Communications (GSM) to mobile phone subscribers all over the world. The GSM standards are defined by the 3GPP collaboration and implemented in hardware and software by equipment manufacturers and mobile phone operators. The common standard makes it possible to use the same phones with different companies' services, or even roam into different countries. GSM is the world's predominant mobile phone standard.

Business process modeling (BPM) is the action of capturing and representing processes of an enterprise, so that the current business processes may be analyzed, applied securely and consistently, improved, and automated.

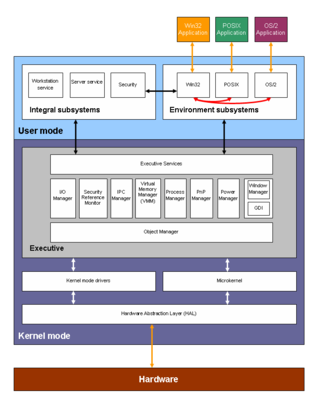
A block diagram is a diagram of a system in which the principal parts or functions are represented by blocks connected by lines that show the relationships of the blocks. They are heavily used in engineering in hardware design, electronic design, software design, and process flow diagrams.
Dynamic enterprise modeling (DEM) is an enterprise modeling approach developed by the Baan company, and used for the Baan enterprise resource planning system which aims "to align and implement it in the organizational architecture of the end-using company".

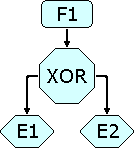
The ARIS concept by August-Wilhelm Scheer aims to ensure that an enterprise information system can completely meet its requirements.
A Piping and Instrumentation Diagram is a detailed diagram in the process industry which shows process equipment together with the instrumentation and control devices. It is also called as mechanical flow diagram (MFD).
The term conceptual model refers to any model that is formed after a conceptualization or generalization process. Conceptual models are often abstractions of things in the real world, whether physical or social. Semantic studies are relevant to various stages of concept formation. Semantics is fundamentally a study of concepts, the meaning that thinking beings give to various elements of their experience.

Business Process Model and Notation (BPMN) is a graphical representation for specifying business processes in a business process model.
A software design description is a representation of a software design that is to be used for recording design information, addressing various design concerns, and communicating that information to the design’s stakeholders. An SDD usually accompanies an architecture diagram with pointers to detailed feature specifications of smaller pieces of the design. Practically, the description is required to coordinate a large team under a single vision, needs to be a stable reference, and outline all parts of the software and how they will work.

In software engineering, structured analysis (SA) and structured design (SD) are methods for analyzing business requirements and developing specifications for converting practices into computer programs, hardware configurations, and related manual procedures.
The Number One Crossbar Switching System (1XB), was the primary technology for urban telephone exchanges served by the Bell System in the mid-20th century. Its switch fabric used the electromechanical crossbar switch to implement the topology of the panel switching system of the 1920s. The first No. 1 Crossbar was installed in the PResident-2 central office at Troy Avenue in Brooklyn, New York which became operational in February 1938.
A signal-flow graph or signal-flowgraph (SFG), invented by Claude Shannon, but often called a Mason graph after Samuel Jefferson Mason who coined the term, is a specialized flow graph, a directed graph in which nodes represent system variables, and branches represent functional connections between pairs of nodes. Thus, signal-flow graph theory builds on that of directed graphs, which includes as well that of oriented graphs. This mathematical theory of digraphs exists, of course, quite apart from its applications.

In systems engineering, software engineering, and computer science, a function model or functional model is a structured representation of the functions within the modeled system or subject area.

A functional flow block diagram (FFBD) is a multi-tier, time-sequenced, step-by-step flow diagram of a system's functional flow. The term "functional" in this context is different from its use in functional programming or in mathematics, where pairing "functional" with "flow" would be ambiguous. Here, "functional flow" pertains to the sequencing of operations, with "flow" arrows expressing dependence on the success of prior operations. FFBDs may also express input and output data dependencies between functional blocks, as shown in figures below, but FFBDs primarily focus on sequencing.

Micro Saint Sharp is a general purpose discrete-event simulation and human performance modeling software tool developed by Alion Science and Technology. It is developed using C# and the .NET Framework. Micro Saint Sharp allows users to create discrete-event simulations as visual task networks with logic defined using the C# programming language.


