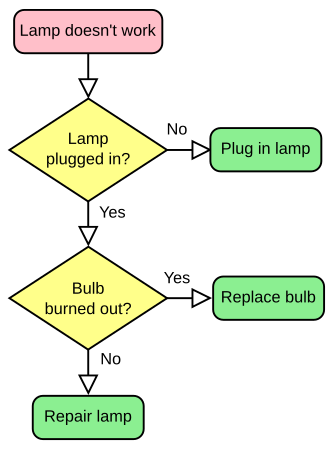
A simple flowchart representing a process for dealing with a non-functioning lamp
A flowchart is a type of diagram that represents a workflow or process. A flowchart can also be defined as a diagrammatic representation of an algorithm, a step-by-step approach to solving a task.
The flowchart shows the steps as boxes of various kinds, and their order by connecting the boxes with arrows. This diagrammatic representation illustrates a solution model to a given problem. Flowcharts are used in analyzing, designing, documenting or managing a process or program in various fields.[1]
Overview
Flow diagram a C-stylefor loop, representing the following code:
for(i=0;i<5;i++) printf("*");
The loop will cause five asterisks to be printed.
Flowcharts are used to design and document simple processes or programs. Like other types of diagrams, they help visualize the process. Two of the many benefits are that flaws and bottlenecks may become apparent. Flowcharts typically use the following main symbols:
A process step, usually called an activity, is denoted by a rectangular box.
A decision is usually denoted by a diamond.
A flowchart is described as "cross-functional" when the chart is divided into different vertical or horizontal parts, to describe the control of different organizational units. A symbol appearing in a particular part is within the control of that organizational unit. A cross-functional flowchart allows the author to correctly locate the responsibility for performing an action or making a decision, and to show the responsibility of each organizational unit for different parts of a single process.
Common alternative names include: flow chart, process flowchart, functional flowchart, process map, process chart, functional process chart, business process model, process model, process flow diagram, work flow diagram, business flow diagram. The terms "flowchart" and "flow chart" are used interchangeably.
The underlying graph structure of a flowchart is a flow graph, which abstracts away node types, their contents and other ancillary information.
History
The first structured method for documenting process flow, the "flow process chart", was introduced by Frank and Lillian Gilbreth in the presentation "Process Charts: First Steps in Finding the One Best Way to do Work", to members of the American Society of Mechanical Engineers (ASME) in 1921.[2] The Gilbreths' tools quickly found their way into industrial engineering curricula. In the early 1930s, an industrial engineer, Allan H. Mogensen, began to train business people in the use of some of the tools of industrial engineering at his Work Simplification Conferences in Lake Placid, New York.
Art Spinanger, a 1944 graduate of Mogensen's class, took the tools back to Procter and Gamble where he developed their Deliberate Methods Change Program. Ben S. Graham, another 1944 graduate, Director of Formcraft Engineering at Standard Register Industrial, applied the flow process chart to information processing with his development of the multi-flow process chart, to present multiple documents and their relationships.[3] In 1947, ASME adopted a symbol set derived from Gilbreth's original work as the "ASME Standard: Operation and Flow Process Charts".[4]
Douglas Hartree in 1949 explained that Herman Goldstine and John von Neumann had developed a flowchart (originally, diagram) to plan computer programs.[5] His contemporary account was endorsed by IBM engineers[6] and by Goldstine's personal recollections.[7] The original programming flowcharts of Goldstine and von Neumann can be found in their unpublished report, "Planning and Coding of Problems for an Electronic Computing Instrument, Part II, Volume 1" (1947), which is reproduced in von Neumann's collected works.[8]
Nevertheless, flowcharts were still used in the early 21st century for describing computer algorithms.[9] Some techniques such as UMLactivity diagrams and Drakon-charts can be considered to be extensions of the flowchart.
Sterneckert (2003) suggested that flowcharts can be modeled from the perspective of different user groups (such as managers, system analysts and clerks), and that there are four general types:[10]
Document flowcharts, showing controls over a document-flow through a system
Data flowcharts, showing controls over a data-flow in a system
System flowcharts, showing controls at a physical or resource level
Program flowchart, showing the controls in a program within a system
Notice that every type of flowchart focuses on some kind of control, rather than on the particular flow itself.[10]
However, there are some different classifications. For example, Andrew Veronis (1978) named three basic types of flowcharts: the system flowchart, the general flowchart, and the detailed flowchart.[11] That same year Marilyn Bohl (1978) stated "in practice, two kinds of flowcharts are used in solution planning: system flowcharts and program flowcharts...".[12] More recently, Mark A. Fryman (2001) identified more differences: "Decision flowcharts, logic flowcharts, systems flowcharts, product flowcharts, and process flowcharts are just a few of the different types of flowcharts that are used in business and government".[13]
In addition, many diagram techniques are similar to flowcharts but carry a different name, such as UMLactivity diagrams.
Reversible flowcharts[14] represent a paradigm in computing that focuses on the reversibility of computational processes. Unlike traditional computing models, where operations are often irreversible, reversible flowcharts ensure that any atomic computational step can be reversed. Reversible flowcharts are shown to be as expressive as reversible Turing machines, and are a theoretical foundation for structured reversible programming and energy-efficient reversible computing systems.[15]
Shows the process's order of operation. A line coming from one symbol and pointing at another.[16] Arrowheads are added if the flow is not the standard top-to-bottom, left-to right.[17]
Indicates the beginning and ending of a program or sub-process. Represented as a stadium,[16] oval or rounded (fillet) rectangle. They usually contain the word "Start" or "End", or another phrase signaling the start or end of a process, such as "submit inquiry" or "receive product".
Shows a conditional operation that determines which one of the two paths the program will take.[16] The operation is commonly a yes/no question or true/false test. Represented as a diamond (rhombus).[17]
Indicating additional information about a step in the program. Represented as an open rectangle with a dashed or solid line connecting it to the corresponding symbol in the flowchart.[17]
A labeled connector for use when the target is on another page. Represented as a home plate-shaped pentagon.[16][20]
Other symbols
The ANSI/ISO standards include symbols beyond the basic shapes. Some are:[19][20]
Shape
Name
Description
Data File or Database
Data represented by a cylinder symbolizing a disk drive.
Document
Single documents represented as a rectangle with a wavy base.
Multiple documents represented as a stack of rectangles with wavy bases.
Manual operation
Represented by a trapezoid with the longest parallel side at the top, to represent an operation or adjustment to process that can only be made manually.
Manual input
Represented by quadrilateral, with the top irregularly sloping up from left to right, like the side view of a keyboard.
Preparation or Initialization
Represented by an elongated hexagon, originally used for steps like setting a switch or initializing a routine.
Parallel processing
Parallel Mode is represented by two horizontal lines at the beginning or ending of simultaneous operations[19]
For parallel and concurrent processing the Parallel Mode horizontal lines[21] or a horizontal bar[22] indicate the start or end of a section of processes that can be done independently:
At a fork, the process creates one or more additional processes, indicated by a bar with one incoming path and two or more outgoing paths.
At a join, two or more processes continue as a single process, indicated by a bar with several incoming paths and one outgoing path. All processes must complete before the single process continues.[22]
Diagramming software
A screenshot of the flowchart software Flowgorithm
Any drawing program can be used to create flowchart diagrams, but these will have no underlying data model to share data with databases or other programs such as project management systems or spreadsheet. Many software packages exist that can create flowcharts automatically, either directly from a programming language source code, or from a flowchart description language.
There are several applications and visual programming languages[23] that use flowcharts to represent and execute programs. Generally these are used as teaching tools for beginner students.
↑Gilbreth, Frank Bunker; Gilbreth, Lillian Moller (1921). "Process Charts"(PDF). Archived from the original(PDF) on 2015-05-09. Retrieved 2016-05-06.. American Society of Mechanical Engineers.
↑Graham, Ben S. Jr. (10 June 1996). "People come first". Keynote Address at Workflow Canada.
↑Jonathan W. Valvano (2011). Embedded Microcomputer Systems: Real Time Interfacing. Cengage Learning. pp.131–132. ISBN978-1-111-42625-5.
12Robbie T. Nakatsu (2009). Reasoning with Diagrams: Decision-Making and Problem-Solving with Diagrams. John Wiley & Sons. pp.68–69. ISBN978-0-470-40072-2.
This page is based on this Wikipedia article Text is available under the CC BY-SA 4.0 license; additional terms may apply. Images, videos and audio are available under their respective licenses.