Event chain methodology is a network analysis technique that is focused on identifying and managing events and relationships between them (event chains) that affect project schedules. It is an uncertainty modeling schedule technique. Event chain methodology is an extension of quantitative project risk analysis with Monte Carlo simulations. It is the next advance beyond critical path method and critical chain project management.[1] Event chain methodology tries to mitigate the effect of motivational and cognitive biases in estimating and scheduling.[2] It improves accuracy of risk assessment and helps to generate more realistic risk adjusted project schedules.[3]
Event chain methodology is an extension of traditional Monte Carlo simulation of project schedules where uncertainties in task duration and costs are defined by statistical distribution.[4][5][6] For example, task duration can be defined by three point estimates: low, base, and high. The results of analysis is a risk adjusted project schedule, crucial tasks, and probabilities that project will be completed on time and on budget. Defining uncertainties using statistical distribution provide accurate results if there is a reliable historical data about duration and cost of similar tasks in previous projects. Another approach is to define uncertainties using risk events or risk drivers, which can be assigned to different tasks or resources.[7][8] Information about probabilities and impact of such events is easier to elicit, which improves accuracy of analysis. Risks can be recorded in the Risk register. Event chain methodology was first proposed in the period of 2002–2004.[9] It is fully or partially implemented in a number of software application.[10] Event Chain Methodology is based on six principles and has a number of outcomes.
Activities (tasks) are not a continuous uniform procedure. Tasks are affected by external events, which transform an activity from one state to another. One of the important properties of an event is the moment when an event occurs during the course of an activity. This moment, when an event occurs, in most cases is probabilistic and can be defined using statistical distribution. The original state is called a ground state, other states are called excited states. For example, if the team completes their job on activity, they can move to other activities. The notion of an activity's state is important because certain events can or cannot occur when activity is in certain state. It means that the state of an activity is subscribed to the events. Events can be local, affecting particular tasks or resources, or global affecting all tasks or resources.
Events can be related to other events, which will create event chains. These event chains can significantly affect the course of the project. For example, requirement changes can cause an activity to be delayed. To accelerate the activity, the project manager allocates a resource from another activity, which then leads to a missed deadline. Eventually, this can lead to the failure of the project. It could be different relationship between events. One event can trigger one or multiple events.
Events can be correlated with each other without one triggering another one. In this case if one risk has occurred, another one will occur and vice versa. One event assigned in one activity can execute another activity or group of activities. In many cases it the execution of risk response plans. For example, event “structural defect is discovered” can cause one or many activities “Repair”. Events can cause other events to occur either immediately or with a delay. The delay is a property of the event subscription. The delay can be deterministic, but in most cases, it is probabilistic. Also risks can be transferred from one activity to another. To define event chains, we need to identify a "sender", the event that initiates the chain of events. The sender event can cause one or more events that effect multiple activities. These are called "receiver" events. In turn, the receiver events can also act as sender events.
Event chain diagrams
Example of event chain diagram: local and global threats and opportunities with different probabilities and impacts
Event chain diagram is a visualization that shows the relationships between events and tasks and how the events affect each other.[11][12] The simplest way to represent these chains is to depict them as arrows associated with certain tasks or time intervals on the Gantt chart. Here are a few important rules:
Event chains diagrams present events as arrows on the Gantt charts.
Arrows pointing down are threats. Arrows pointing up are opportunities.
Issues are shown as an arrow within a circle. Color of the issue arrow is red (dark).
Closed or transferred risks are shown using dashed lines. Color of arrow is white. Closed issue is shown in the circle with dashed border line.
Excited states are represented by elevating the associated section of the bar on the Gantt chart.
Colors represent the calculated impact of the risk. Higher impacts are red or darker shade. Low impacts are green or lighter shade. The size of the arrow represents probability.
Event chains are shown as lines connecting arrows depicting events.
Event chains may trigger another activity. In this case event chain line will be connected with the beginning of activity with optional arrow.
Event chains may trigger a group of activities. In this case this group of activities will be surrounded by the box or frame and event chain line will be connected to the corner of the box or first activity within a frame.
By using event chain diagrams to visualize events and event chains, the modeling and analysis of risks and uncertainties can be significantly simplified.
Example of event chain diagram with critical event chain and activity triggered by event
Another tool that can be used to simplify the definition of events is a state table. Columns in the state table represent events; rows represent the states of an activity. Information for each event in each state includes four properties of event subscription: probability, moment of event, excited state, and impact of the event.
Monte Carlo simulation
Once events and event chains are defined, quantitative analysis using Monte Carlo simulation can be performed to quantify the cumulative effect of the events.[13] Probabilities and impacts of risks assigned to activities are used as input data for Monte Carlo simulation of the project schedule.[14] In most projects it is necessary to supplement the event based variance with uncertainties as distributions related to duration, start time, cost, and other parameters.
In Event chain methodology, risk can not only affect schedule and cost, but also other parameters such as safety, security, performance, technology, quality, and other objectives. In other words, one event can belong to different categories.[15] The result of the analysis would show risk exposure for different categories as well as integrated project risk score for all categories. This integrated project risk score is calculated based on relative weights for each risk category.
Monte Carlo simulation provides the capability, through sensitivity analysis, to identify single or chains of events. These chains of events can be identified by analyzing the correlations between the main project parameters, such as project duration or cost, and the event chains. These are called “critical events” or “critical chains of events”. By identifying critical events or critical chains of events, we can identify strategies to minimize their negative effects: Avoid, Transfer, Mitigate, or Accept. Event and event chain ranking is performed for all risk categories (schedule-related and non-schedule) as part of one process. Integrated risk probability, impact and score can be calculated using weights for each risk category.
Monitoring the activity's progress ensures that updated information is used to perform the analysis. During the course of the project, the probability and time of the events can be recalculated based on actual data. The main reason for performance tracking is forecasting an activity's duration and cost if an activity is partially completed and certain events are assigned to the activity. Event chain methodology reduces the risk probability and impact automatically based on the percent of work completed. Advanced analysis can be performed using a Bayesian approach. It is possible to monitor the chance that a project will meet a specific deadline. This chance is constantly updated as a result of the Monte Carlo analysis. Critical events and event chains can be different at the various phases of the project
Sometimes events can cause the start of an activity that has already been completed. This is a very common scenario for real life projects; sometimes a previous activity must be repeated based on the results of a succeeding activity. Event chain methodology simplifies modeling of these scenarios. The original project schedule does not need to be updated, all that is required is to define the event and assign it to an activity that points to the previous activity. In addition, a limit to the number of times an activity can be repeated must be defined.
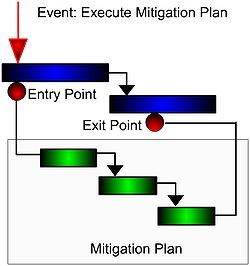
If an event or event chain occurs during the course of a project, it may require some risk response effort.
Risk response plans execution are triggered by events, which occur if an activity is in an excited state. Risk response events may attempt to transform the activity from the excited state to the ground state. Response plans are an activity or group of activities (small schedule) that augment the project schedule if a certain event occurs. The solution is to assign the response plan to an event or event chain. The same response plan can be used for one or more events.
One potential event is the reassignment of a resource from one activity to another, which can occur under certain conditions. For example, if an activity requires more resources to complete it within a fixed period, this will trigger an event to reallocate the resource from another activity. Reallocation of resources can also occur when activity duration reaches a certain deadline or the cost exceeds a certain value. Events can be used to model different situations with resources, e.g. temporary leave, illness, vacations, etc.
↑ Virine, Lev; Trumper, Michael (2007). Project Decisions: The Art and Science. Berrett-Koehler Publishers. ISBN978-1567262179.
↑ Robyn M. Dawes and Bernard Corrigan, ‘‘Linear Models in Decision Making’’ Psychological Bulletin 81, no. 2 (1974): 93–106.
↑ Virine, Lev (2013). Integrated Qualitative and Quantitative Risk Analysis of Project Portfolios. In Proceedings of Enterprise Risk Management Symposium. April 22–23, 2013, Chicago, IL
↑ Vose, David (2008). Risk Analysis: A Quantitative Guide (3rded.). Great Britain: Wiley. ISBN978-0-470-51284-5.{{cite book}}: CS1 maint: publisher location (link)
↑ Hillson, David (2012). Practical Risk Management: The ATOM Methodology (2nded.). Berrett-Koehler Publishers. ISBN978-1567263664.
↑ Hillson, David (2009). Managing Risk in Projects (Fundamentals of Project Management). Routledge. ISBN978-0566088674.
↑ Hulett, David (2009). Practical Schedule Risk Analysis. Routledge. ISBN978-0566087905.
↑ Hulett, David (2011). Integrated Cost-Schedule Risk Analysis. Routledge. ISBN978-0566091667.
↑ Virine, Lev (2013). Integrated Qualitative and Quantitative Risk Analysis of Project Portfolios. In Proceedings of 2013 Enterprise Risk Management Symposium, April 22–24, Chicago, IL
↑ Virine, Lev. and Trumper, Michael. (2015). Predicting the unpredictable: how to analyze project risks using event chain methodology. PM Network, 29(9), 28–29
↑ Virine, Lev & McVean, Jason. (2004). Visual Modeling of Business Problems: Workflow and Patterns, In Proceedings of 2004 Winter Simulation Conference, Washington DC.
↑ Virine, Lev & Rapley, Lisa. (2003). Visualization of Probabilistic Business Models, In Proceedings of 2003 Winter Simulation Conference, New Orleans, LA.
↑ Williams, T. "Why Monte Carlo simulations of project networks can mislead". Project Management Journal, Vol 35. Issue 3, (2004): 53-61
↑ Agarwal, Ruchi. and Virine, Lev. (2017). Monte Carlo Project Risk Analysis. In Raydugin, Y. (ed) Handbook of Research on Leveraging Risk and Uncertainties for Effective Project Management. IGI Global; 1 edition
Hammond, J.S. and Keeney, R.L. and Raiffa, H., Smart Choices: A Practical Guide to Making Better Decisions (1999). Harvard Business School Press
D. Kahneman and A. Tversky (ed.) (1982). Judgement under Uncertainty: Heuristics and Biases. Cambridge University Press. ISBN0-521-28414-7
Keeney, R.L., Value-focused thinking: A Path to Creative Decisionmaking (1992). Harvard University Press. ISBN0-674-93197-1
Matheson, David, and Matheson, Jim, The Smart Organization: Creating Value through Strategic R&D (1998). Harvard Business School Press. ISBN0-87584-765-X
Raiffa, Howard, Decision Analysis: Introductory Readings on Choices Under Uncertainty (1997). McGraw Hill. ISBN0-07-052579-X
Robert C.P. and G. Casella. "Monte Carlo Statistical Methods" (second edition). New York: Springer-Verlag, 2004, ISBN0-387-21239-6
This page is based on this Wikipedia article Text is available under the CC BY-SA 4.0 license; additional terms may apply. Images, videos and audio are available under their respective licenses.