
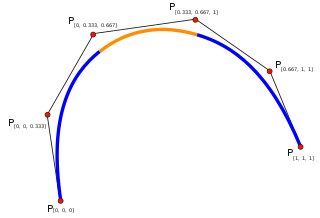
A Bézier curve is a parametric curve used in computer graphics and related fields. A set of discrete "control points" defines a smooth, continuous curve by means of a formula. Usually the curve is intended to approximate a real-world shape that otherwise has no mathematical representation or whose representation is unknown or too complicated. The Bézier curve is named after French engineer Pierre Bézier (1910–1999), who used it in the 1960s for designing curves for the bodywork of Renault cars. Other uses include the design of computer fonts and animation. Bézier curves can be combined to form a Bézier spline, or generalized to higher dimensions to form Bézier surfaces. The Bézier triangle is a special case of the latter.

Computer animation is the process used for digitally generating moving images. The more general term computer-generated imagery (CGI) encompasses both still images and moving images, while computer animation only refers to moving images. Modern computer animation usually uses 3D computer graphics.

In geometry, the tangent line (or simply tangent) to a plane curve at a given point is, intuitively, the straight line that "just touches" the curve at that point. Leibniz defined it as the line through a pair of infinitely close points on the curve. More precisely, a straight line is tangent to the curve y = f(x) at a point x = c if the line passes through the point (c, f(c)) on the curve and has slope f'(c), where f' is the derivative of f. A similar definition applies to space curves and curves in n-dimensional Euclidean space.

Blender is a free and open-source 3D computer graphics software tool set that runs on Windows, MacOS, BSD, Haiku, IRIX and Linux. It is used for creating animated films, visual effects, art, 3D-printed models, motion graphics, interactive 3D applications, virtual reality, and, formerly, video games.
Inbetweening, also known as tweening, is a process in animation that involves creating intermediate frames, called inbetweens, between two keyframes. The intended result is to create the illusion of movement by smoothly transitioning one image into another.
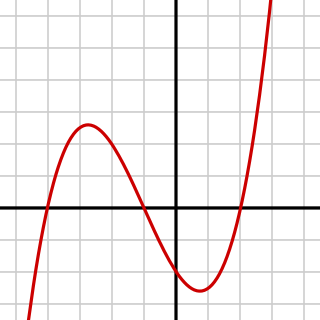
In mathematics, a cubic function is a function of the form that is, a polynomial function of degree three. In many texts, the coefficientsa, b, c, and d are supposed to be real numbers, and the function is considered as a real function that maps real numbers to real numbers or as a complex function that maps complex numbers to complex numbers. In other cases, the coefficients may be complex numbers, and the function is a complex function that has the set of the complex numbers as its codomain, even when the domain is restricted to the real numbers.

Non-uniform rational basis spline (NURBS) is a mathematical model using basis splines (B-splines) that is commonly used in computer graphics for representing curves and surfaces. It offers great flexibility and precision for handling both analytic and modeled shapes. It is a type of curve modeling, as opposed to polygonal modeling or digital sculpting. NURBS curves are commonly used in computer-aided design (CAD), manufacturing (CAM), and engineering (CAE). They are part of numerous industry-wide standards, such as IGES, STEP, ACIS, and PHIGS. Tools for creating and editing NURBS surfaces are found in various 3D graphics, rendering, and animation software packages.
Autodesk 3ds Max, formerly 3D Studio and 3D Studio Max, is a professional 3D computer graphics program for making 3D animations, models, games and images. It is developed and produced by Autodesk Media and Entertainment. It has modeling capabilities and a flexible plugin architecture and must be used on the Microsoft Windows platform. It is frequently used by video game developers, many TV commercial studios, and architectural visualization studios. It is also used for movie effects and movie pre-visualization. 3ds Max features shaders, dynamic simulation, particle systems, radiosity, normal map creation and rendering, global illumination, a customizable user interface, and its own scripting language.
In mathematics, a spline is a function defined piecewise by polynomials. In interpolating problems, spline interpolation is often preferred to polynomial interpolation because it yields similar results, even when using low degree polynomials, while avoiding Runge's phenomenon for higher degrees.

Motion is a software application produced by Apple Inc. for their macOS operating system. It is used to create and edit motion graphics, titling for video production and film production, and 2D and 3D compositing for visual effects.
In numerical analysis, a cubic Hermite spline or cubic Hermite interpolator is a spline where each piece is a third-degree polynomial specified in Hermite form, that is, by its values and first derivatives at the end points of the corresponding domain interval.
In computer graphics, slerp is shorthand for spherical linear interpolation, introduced by Ken Shoemake in the context of quaternion interpolation for the purpose of animating 3D rotation. It refers to constant-speed motion along a unit-radius great circle arc, given the ends and an interpolation parameter between 0 and 1.
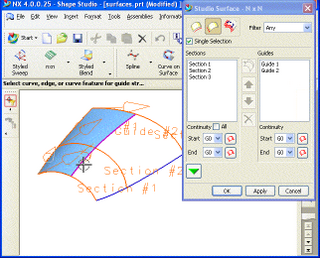
Freeform surface modelling is a technique for engineering freeform surfaces with a CAD or CAID system.
Computer facial animation is primarily an area of computer graphics that encapsulates methods and techniques for generating and animating images or models of a character face. The character can be a human, a humanoid, an animal, a legendary creature or character, etc. Due to its subject and output type, it is also related to many other scientific and artistic fields from psychology to traditional animation. The importance of human faces in verbal and non-verbal communication and advances in computer graphics hardware and software have caused considerable scientific, technological, and artistic interests in computer facial animation.

Motion graphics are pieces of animation or digital footage that create the illusion of motion or rotation, and are usually combined with audio for use in multimedia projects. Motion graphics are usually displayed via electronic media technology, but may also be displayed via manual powered technology. The term distinguishes static graphics from those with a transforming appearance over time, without over-specifying the form. While any form of experimental or abstract animation can be called motion graphics, the term typically more explicitly refers to the commercial application of animation and effects to video, film, TV, and interactive applications.

Elastic Reality was a warping and morphing software application available on Windows, Macintosh, and Silicon Graphics workstations and was discontinued in 1999.
Blocking is an animation technique in which key poses are created to establish timing and placement of characters and props in a given scene or shot. This technique is most commonly used in 3D computer animation, where it is sometimes referred to as Stepped animation.
In the context of live-action and computer animation, interpolation is inbetweening, or filling in frames between the key frames. It typically calculates the in-between frames through use of (usually) piecewise polynomial interpolation to draw images semi-automatically.

OpenShot Video Editor is a free and open-source video editor for Windows, macOS, Linux, and ChromeOS. The project started in August 2008 by Jonathan Thomas, with the objective of providing a stable, free, and friendly to use video editor.

Natron is a free and open-source node-based compositing application. It has been influenced by digital compositing software such as Avid Media Illusion, Apple Shake, Blackmagic Fusion, Autodesk Flame and Nuke, from which its user interface and many of its concepts are derived.