Linear interpolation

Last updated
Given the two red points, the blue line is the linear interpolant between the points, and the value y at x may be found by linear interpolation. LinearInterpolation.svg
Given the two red points, the blue line is the linear interpolant between the points, and the value y at x may be found by linear interpolation.

In mathematics, linear interpolation is a method of curve fitting using linear polynomials to construct new data points within the range of a discrete set of known data points.

Contents

Linear interpolation between two known points

In this geometric visualisation, the value at the green circle multiplied by the horizontal distance between the red and blue circles is equal to the sum of the value at the red circle multiplied by the horizontal distance between the green and blue circles, and the value at the blue circle multiplied by the horizontal distance between the green and red circles. Linear interpolation visualisation.svg
In this geometric visualisation, the value at the green circle multiplied by the horizontal distance between the red and blue circles is equal to the sum of the value at the red circle multiplied by the horizontal distance between the green and blue circles, and the value at the blue circle multiplied by the horizontal distance between the green and red circles.

If the two known points are given by the coordinates and , the linear interpolant is the straight line between these points. For a value in the interval , the value along the straight line is given from the equation of slopes

which can be derived geometrically from the figure on the right. It is a special case of polynomial interpolation with .

Solving this equation for , which is the unknown value at , gives

which is the formula for linear interpolation in the interval . Outside this interval, the formula is identical to linear extrapolation.

This formula can also be understood as a weighted average. The weights are inversely related to the distance from the end points to the unknown point; the closer point has more influence than the farther point. Thus, the weights are and , which are normalized distances between the unknown point and each of the end points. Because these sum to 1,

yielding the formula for linear interpolation given above.

Interpolation of a data set

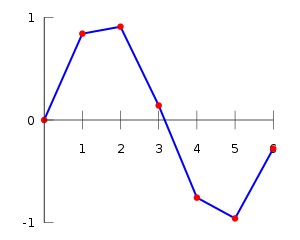
Linear interpolation on a data set (red points) consists of pieces of linear interpolants (blue lines). Interpolation example linear.svg
Linear interpolation on a data set (red points) consists of pieces of linear interpolants (blue lines).

Linear interpolation on a set of data points (x0, y0), (x1, y1), ..., (xn, yn) is defined as piecewise linear, resulting from the concatenation of linear segment interpolants between each pair of data points. This results in a continuous curve, with a discontinuous derivative (in general), thus of differentiability class .

Linear interpolation as an approximation

Linear interpolation is often used to approximate a value of some function f using two known values of that function at other points. The error of this approximation is defined as

where p denotes the linear interpolation polynomial defined above:

It can be proven using Rolle's theorem that if f has a continuous second derivative, then the error is bounded by

That is, the approximation between two points on a given function gets worse with the second derivative of the function that is approximated. This is intuitively correct as well: the "curvier" the function is, the worse the approximations made with simple linear interpolation become.

History and applications

Linear interpolation has been used since antiquity for filling the gaps in tables. Suppose that one has a table listing the population of some country in 1970, 1980, 1990 and 2000, and that one wanted to estimate the population in 1994. Linear interpolation is an easy way to do this. It is believed that it was used in the Seleucid Empire (last three centuries BC) and by the Greek astronomer and mathematician Hipparchus (second century BC). A description of linear interpolation can be found in the ancient Chinese mathematical text called The Nine Chapters on the Mathematical Art (九章算術), [1] dated from 200 BC to AD 100 and the Almagest (2nd century AD) by Ptolemy.

The basic operation of linear interpolation between two values is commonly used in computer graphics. In that field's jargon it is sometimes called a lerp (from linear interpolation). The term can be used as a verb or noun for the operation. e.g. "Bresenham's algorithm lerps incrementally between the two endpoints of the line."

Lerp operations are built into the hardware of all modern computer graphics processors. They are often used as building blocks for more complex operations: for example, a bilinear interpolation can be accomplished in three lerps. Because this operation is cheap, it's also a good way to implement accurate lookup tables with quick lookup for smooth functions without having too many table entries.

Extensions

Comparison of linear and bilinear interpolation some 1- and 2-dimensional interpolations.
Black and red
/yellow
/green
/blue dots correspond to the interpolated point and neighbouring samples, respectively.
Their heights above the ground correspond to their values. Comparison of 1D and 2D interpolation.svg
Comparison of linear and bilinear interpolation some 1- and 2-dimensional interpolations.
Black and red/yellow/green/blue dots correspond to the interpolated point and neighbouring samples, respectively.
Their heights above the ground correspond to their values.

Accuracy

If a C0 function is insufficient, for example if the process that has produced the data points is known to be smoother than C0, it is common to replace linear interpolation with spline interpolation or, in some cases, polynomial interpolation.

Multivariate

Linear interpolation as described here is for data points in one spatial dimension. For two spatial dimensions, the extension of linear interpolation is called bilinear interpolation, and in three dimensions, trilinear interpolation. Notice, though, that these interpolants are no longer linear functions of the spatial coordinates, rather products of linear functions; this is illustrated by the clearly non-linear example of bilinear interpolation in the figure below. Other extensions of linear interpolation can be applied to other kinds of mesh such as triangular and tetrahedral meshes, including Bézier surfaces. These may be defined as indeed higher-dimensional piecewise linear functions (see second figure below).

Example of bilinear interpolation on the unit square with the z values 0, 1, 1, and 0.5 as indicated. Interpolated values in between are represented by colour. Bilininterp.png
Example of bilinear interpolation on the unit square with the z values 0, 1, 1, and 0.5 as indicated. Interpolated values in between are represented by colour.
A piecewise linear function in two dimensions (top) and the convex polytopes on which it is linear (bottom) Piecewise linear function2D.svg
A piecewise linear function in two dimensions (top) and the convex polytopes on which it is linear (bottom)

Programming language support

Many libraries and shading languages have a "lerp" helper-function (in GLSL known instead as mix), returning an interpolation between two inputs (v0, v1) for a parameter t in the closed unit interval [0, 1]. Signatures between lerp functions are variously implemented in both the forms (v0, v1, t) and (t, v0, v1).

// Imprecise method, which does not guarantee v = v1 when t = 1, due to floating-point arithmetic error.// This method is monotonic. This form may be used when the hardware has a native fused multiply-add instruction.floatlerp(floatv0,floatv1,floatt){returnv0+t*(v1-v0);}// Precise method, which guarantees v = v1 when t = 1. This method is monotonic only when v0 * v1 < 0.// Lerping between same values might not produce the same valuefloatlerp(floatv0,floatv1,floatt){return(1-t)*v0+t*v1;}

This lerp function is commonly used for alpha blending (the parameter "t" is the "alpha value"), and the formula may be extended to blend multiple components of a vector (such as spatial x, y, z axes or r, g, b colour components) in parallel.

See also

Related Research Articles

<span class="mw-page-title-main">Interpolation</span> Method for estimating new data within known data points

In the mathematical field of numerical analysis, interpolation is a type of estimation, a method of constructing (finding) new data points based on the range of a discrete set of known data points.

<span class="mw-page-title-main">Linear equation</span> Equation that does not involve powers or products of variables

In mathematics, a linear equation is an equation that may be put in the form where are the variables, and are the coefficients, which are often real numbers. The coefficients may be considered as parameters of the equation and may be arbitrary expressions, provided they do not contain any of the variables. To yield a meaningful equation, the coefficients are required to not all be zero.

<span class="mw-page-title-main">Tangent</span> In mathematics, straight line touching a plane curve without crossing it

In geometry, the tangent line (or simply tangent) to a plane curve at a given point is, intuitively, the straight line that "just touches" the curve at that point. Leibniz defined it as the line through a pair of infinitely close points on the curve. More precisely, a straight line is tangent to the curve y = f(x) at a point x = c if the line passes through the point (c, f(c)) on the curve and has slope f'(c), where f' is the derivative of f. A similar definition applies to space curves and curves in n-dimensional Euclidean space.

Bresenham's line algorithm is a line drawing algorithm that determines the points of an n-dimensional raster that should be selected in order to form a close approximation to a straight line between two points. It is commonly used to draw line primitives in a bitmap image, as it uses only integer addition, subtraction, and bit shifting, all of which are very cheap operations in historically common computer architectures. It is an incremental error algorithm, and one of the earliest algorithms developed in the field of computer graphics. An extension to the original algorithm called the midpoint circle algorithm may be used for drawing circles.

In numerical analysis, polynomial interpolation is the interpolation of a given bivariate data set by the polynomial of lowest possible degree that passes through the points of the dataset.

In the mathematical field of numerical analysis, a Newton polynomial, named after its inventor Isaac Newton, is an interpolation polynomial for a given set of data points. The Newton polynomial is sometimes called Newton's divided differences interpolation polynomial because the coefficients of the polynomial are calculated using Newton's divided differences method.

<span class="mw-page-title-main">Lagrange polynomial</span> Polynomials used for interpolation

In numerical analysis, the Lagrange interpolating polynomial is the unique polynomial of lowest degree that interpolates a given set of data.

In linear algebra, a Vandermonde matrix, named after Alexandre-Théophile Vandermonde, is a matrix with the terms of a geometric progression in each row: an matrix

In the mathematical field of numerical analysis, spline interpolation is a form of interpolation where the interpolant is a special type of piecewise polynomial called a spline. That is, instead of fitting a single, high-degree polynomial to all of the values at once, spline interpolation fits low-degree polynomials to small subsets of the values, for example, fitting nine cubic polynomials between each of the pairs of ten points, instead of fitting a single degree-nine polynomial to all of them. Spline interpolation is often preferred over polynomial interpolation because the interpolation error can be made small even when using low-degree polynomials for the spline. Spline interpolation also avoids the problem of Runge's phenomenon, in which oscillation can occur between points when interpolating using high-degree polynomials.

In multivariable calculus, the implicit function theorem is a tool that allows relations to be converted to functions of several real variables. It does so by representing the relation as the graph of a function. There may not be a single function whose graph can represent the entire relation, but there may be such a function on a restriction of the domain of the relation. The implicit function theorem gives a sufficient condition to ensure that there is such a function.

In the mathematical field of numerical analysis, De Casteljau's algorithm is a recursive method to evaluate polynomials in Bernstein form or Bézier curves, named after its inventor Paul de Casteljau. De Casteljau's algorithm can also be used to split a single Bézier curve into two Bézier curves at an arbitrary parameter value.

<span class="mw-page-title-main">Bilinear interpolation</span> Method of interpolating functions on a 2D grid

In mathematics, bilinear interpolation is a method for interpolating functions of two variables using repeated linear interpolation. It is usually applied to functions sampled on a 2D rectilinear grid, though it can be generalized to functions defined on the vertices of arbitrary convex quadrilaterals.

In mathematics, divided differences is an algorithm, historically used for computing tables of logarithms and trigonometric functions. Charles Babbage's difference engine, an early mechanical calculator, was designed to use this algorithm in its operation.

In economics, an ordinal utility function is a function representing the preferences of an agent on an ordinal scale. Ordinal utility theory claims that it is only meaningful to ask which option is better than the other, but it is meaningless to ask how much better it is or how good it is. All of the theory of consumer decision-making under conditions of certainty can be, and typically is, expressed in terms of ordinal utility.

In numerical analysis, Hermite interpolation, named after Charles Hermite, is a method of polynomial interpolation, which generalizes Lagrange interpolation. Lagrange interpolation allows computing a polynomial of degree less than n that takes the same value at n given points as a given function. Instead, Hermite interpolation computes a polynomial of degree less than mn such that the polynomial and its first m − 1 derivatives have the same values at n given points as a given function and its first m − 1 derivatives.

For digital image processing, the Focus recovery from a defocused image is an ill-posed problem since it loses the component of high frequency. Most of the methods for focus recovery are based on depth estimation theory. The Linear canonical transform (LCT) gives a scalable kernel to fit many well-known optical effects. Using LCTs to approximate an optical system for imaging and inverting this system, theoretically permits recovery of a defocused image.

In the field of mathematical analysis, an interpolation space is a space which lies "in between" two other Banach spaces. The main applications are in Sobolev spaces, where spaces of functions that have a noninteger number of derivatives are interpolated from the spaces of functions with integer number of derivatives.

In algebra, a multilinear polynomial is a multivariate polynomial that is linear in each of its variables separately, but not necessarily simultaneously. It is a polynomial in which no variable occurs to a power of 2 or higher; that is, each monomial is a constant times a product of distinct variables. For example f(x,y,z) = 3xy + 2.5 y - 7z is a multilinear polynomial of degree 2 whereas f(x,y,z) = x² +4y is not. The degree of a multilinear polynomial is the maximum number of distinct variables occurring in any monomial.

In Euclidean geometry, the distance from a point to a line is the shortest distance from a given point to any point on an infinite straight line. It is the perpendicular distance of the point to the line, the length of the line segment which joins the point to nearest point on the line. The algebraic expression for calculating it can be derived and expressed in several ways.

<span class="mw-page-title-main">Linear function (calculus)</span> Polynomial function of degree at most one

In calculus and related areas of mathematics, a linear function from the real numbers to the real numbers is a function whose graph is a non-vertical line in the plane. The characteristic property of linear functions is that when the input variable is changed, the change in the output is proportional to the change in the input.

References

  1. Joseph Needham (1 January 1959). Science and Civilisation in China: Volume 3, Mathematics and the Sciences of the Heavens and the Earth. Cambridge University Press. pp. 147–. ISBN   978-0-521-05801-8.