History of First Break Picking
Gelchinsky and Shtivelman [2] (1983) used correlation properties of signals and applied a statistical criterion for the estimation of first arrivals time.
Coppens [3] (1985) calculated the ratio of energy of seismogram of the two windows and used that to differentiate in signal and noise.
Michael D. McCormark et al. [4] (1993) introduced a backpropagation neural network (BNN) method. The Neural network which edits seismic data or pick first breaks was trained by users, who were just selecting and presenting to the network examples of trace edits or refraction picks. The network then changes internal weights iteratively until it can reproduce the examples accurately provided by the users.
Fabio Boschetti et al. [5] (1996) introduce a fractal-based algorithm, which detects the presence of a signal by analyzing the variation in fractal dimension along the trace. This method works when signal-to-noise ratio is small, but it is considerably slow.
A direct correlation method was introduced by Joseph et al. [6] (1999) which was developed for use in highly time-resolved, low-noise signals acquired in the laboratory. In this method, the greatest value of Pearson's correlation coefficient between segments of observed waveforms near the pulse onset and at an appropriate reference serves as the time determination criterion.
Zuolin Chen, et al. [7] (2005) introduced a multi-window algorithm to detect the first break. In this method, three moving windows were used and the averages of absolute amplitudes in each window need to be calculated, then ratios based on the averages of the windows provide standards to differentiate signals from unwanted noise.
Wong et al. [8] (2009) introduced STA/LTA ratio method. This method is similar as Coppens' [3] algorithm. The difference is to do the ratio of two averages of energy between a short-term window and a long-term window, which is denoted as STA/LTA (short-term average/long-term average), instead of calculating the ratio of energy of seismogram of the two windows in Coppens' algorithm.
Methods of Automatic First Break Picking
STA/LTA ratio Method [8]
This method is similar as Coppens' (1985) algorithm. The difference is to do the ratio of two averages of energy between a short-term window and a long-term window, which is denoted as STA/LTA (short-term average/long-term average), instead of calculating the ratio of energy of seismogram of the two windows in Coppens' algorithm. The numerical derivative of the ratio can be defined as,

where ri+1 is the STA/LTA ratio at time index i+1, and ri is the STA/LTA ratio at time index i. For noise-free seismograms, the maximum value of the numerical derivative of the STA/LTA ratio is close to the time of the first arrival.
Wong et al. (2009) modified the algorithm of the energy ratio method, where they named the method as modified energy ratio. In this method, they define the energy ratio as,

where xi is the times series representing a seismogram with the time index i=1, 2 ... N. and the number of points in an energy window is ne. Then, the modified energy ratio is defined as

The peak of the modified energy ratio er3i is very closed to the time of first arrivals on noise-free seismograms.
Multi-Window Method [7]
This method needs to calculate the averages of absolute amplitudes from a seismic trace by using three moving time windows before and after each time point (sample).
When the instantaneous absolute amplitude exceeds an automatically adjusted threshold, ratios based on the averages of the windows over previous time samples provide standards to differentiate signals from unwanted noise.
The multi-window automatic P phase picker operates in the time-domain. It includes procedures to define: time windows, standards, corresponding thresholds and waveform correction.
1. The averages of absolute amplitudes within BTA (Before Term Average), ATA (After Term Average) and DTA (Delayed Term Average) windows are respectively defined as follows:

Standards R2(t) and R3(t) are used for the discrimination of high-amplitude short-duration and long-duration noise.
2.Thresholds is defined as

where Em is mean and Esd is standard deviation; p is the number of shifted samples; α is the coefficient to adjust the height of the first threshold and is taken to be 3. From this equation it is obvious that H1(t) is automatically adjusted with the variance of the background noise.
3. H1(t) is defined larger than most pre-existing noise levels, and the instantaneous absolute amplitude at the trigger time point is higher than H1(t), according to the configuration of the first arrival of an event the real onset time must be earlier than the trigger time point. A waveform correction should be used to compensate this belated onset time. For an impulsive first arrival, the height of the absolute amplitude and the representative gradient at the trigger point can be used to accomplish the correction.
Signal-to-noise ratio is a measure used in science and engineering that compares the level of a desired signal to the level of background noise. SNR is defined as the ratio of signal power to the noise power, often expressed in decibels. A ratio higher than 1:1 indicates more signal than noise.

A seismogram is a graph output by a seismograph. It is a record of the ground motion at a measuring station as a function of time. Seismograms typically record motions in three cartesian axes, with the z axis perpendicular to the Earth's surface and the x- and y- axes parallel to the surface. The energy measured in a seismogram may result from an earthquake or from some other source, such as an explosion. Seismograms can record many things, and record many little waves, called microseisms. These tiny microseisms can be caused by heavy traffic near the seismograph, waves hitting a beach, the wind, and any number of other ordinary things that cause some shaking of the seismograph.

In mathematics, deconvolution is the operation inverse to convolution. Both operation are used in signal processing and image processing. For example, convolution can be used to apply a filter, and it may be possible to recover the original signal using deconvolution.

Reflection seismology is a method of exploration geophysics that uses the principles of seismology to estimate the properties of the Earth's subsurface from reflected seismic waves. The method requires a controlled seismic source of energy, such as dynamite or Tovex blast, a specialized air gun or a seismic vibrator. Reflection seismology is similar to sonar and echolocation. This article is about surface seismic surveys; for vertical seismic profiles, see VSP.
Seismic Handler (SH) is an interactive analysis program for preferably continuous waveform data. It was developed at the Seismological Observatory Gräfenberg and is in use there for daily routine analysis of local and global seismic events. In original form Seismic Handler was command line based, but now an interactive version is available.
In statistical signal processing, the goal of spectral density estimation (SDE) is to estimate the spectral density of a random signal from a sequence of time samples of the signal. Intuitively speaking, the spectral density characterizes the frequency content of the signal. One purpose of estimating the spectral density is to detect any periodicities in the data, by observing peaks at the frequencies corresponding to these periodicities.
The Hilbert–Huang transform (HHT) is a way to decompose a signal into so-called intrinsic mode functions (IMF) along with a trend, and obtain instantaneous frequency data. It is designed to work well for data that is nonstationary and nonlinear. In contrast to other common transforms like the Fourier transform, the HHT is more like an algorithm that can be applied to a data set, rather than a theoretical tool.
Seismic Unix is an open source seismic utilities package which was supported by the Center for Wave Phenomena (CWP) at the Colorado School of Mines (CSM). Currently it is supported by John Stockwell.
The Richter scale – also called the Richter magnitude scale or Richter's magnitude scale – is a measure of the strength of earthquakes, developed by Charles F. Richter and presented in his landmark 1935 paper, where he called it the "magnitude scale". This was later revised and renamed the local magnitude scale, denoted as ML or ML .
A synthetic seismogram is the result of forward modelling the seismic response of an input earth model, which is defined in terms of 1D, 2D or 3D variations in physical properties. In hydrocarbon exploration this is used to provide a 'tie' between changes in rock properties in a borehole and seismic reflection data at the same location. It can also be used either to test possible interpretation models for 2D and 3D seismic data or to model the response of the predicted geology as an aid to planning a seismic reflection survey. In the processing of wide-angle reflection and refraction (WARR) data, synthetic seismograms are used to further constrain the results of seismic tomography. In earthquake seismology, synthetic seismograms are used either to match the predicted effects of a particular earthquake source fault model with observed seismometer records or to help constrain the Earth's velocity structure. Synthetic seismograms are generated using specialized geophysical software.
In geophysics, geology, civil engineering, and related disciplines, seismic noise is a generic name for a relatively persistent vibration of the ground, due to a multitude of causes, that is often a non-interpretable or unwanted component of signals recorded by seismometers.
The concept of Earthquake Duration Magnitude – originally proposed by E. Bisztricsany in 1958 using surface waves only - is based on the realization that on a recorded earthquake seismogram, the total length of the seismic wavetrain – sometimes referred to as the CODA – reflects its size. Thus larger earthquakes give longer seismograms [as well as stronger seismic waves] than small ones. The seismic wave interval measured on the time axis of an earthquake record - starting with the first seismic wave onset until the wavetrain amplitude diminishes to at least 10% of its maximum recorded value - is referred to as "earthquake duration". It is this concept that Bisztricsany first used to develop his Earthquake Duration Magnitude Scale employing surface wave durations.

Seismic inversion involves the set of methods which seismologists use to infer properties through physical measurements. Surface-wave inversion is the method by which elastic properties, density, and thickness of layers in the subsurface are obtained through analysis of surface-wave dispersion. The entire inversion process requires the gathering of seismic data, the creation of dispersion curves, and finally the inference of subsurface properties.

The Kolmogorov–Zurbenko (KZ) filter was first proposed by A. N. Kolmogorov and formally defined by Zurbenko. It is a series of iterations of a moving average filter of length m, where m is a positive, odd integer. The KZ filter belongs to the class of low-pass filters. The KZ filter has two parameters, the length m of the moving average window and the number of iterations k of the moving average itself. It also can be considered as a special window function designed to eliminate spectral leakage.
Forensic seismology is the forensic use of the techniques of seismology to detect and study distant phenomena, particularly explosions, including those of nuclear weapons.
In reflection seismology, the anelastic attenuation factor, often expressed as seismic quality factor or Q, quantifies the effects of anelastic attenuation on the seismic wavelet caused by fluid movement and grain boundary friction. As a seismic wave propagates through a medium, the elastic energy associated with the wave is gradually absorbed by the medium, eventually ending up as heat energy. This is known as absorption and will eventually cause the total disappearance of the seismic wave.
Stabilized inverse Q filtering is a data processing technology for enhancing the resolution of reflection seismology images where the stability of the method used is considered. Q is the anelastic attenuation factor or the seismic quality factor, a measure of the energy loss as the seismic wave moves. To obtain a solution when we make computations with a seismic model we always have to consider the problem of instability and try to obtain a stabilized solution for seismic inverse Q filtering.
A seismic array is a system of linked seismometers arranged in a regular geometric pattern to increase sensitivity to earthquake and explosion detection. A seismic array differs from a local network of seismic stations mainly by the techniques used for data analysis. The data from a seismic array is obtained using special digital signal processing techniques such as beamforming, which suppress noises and thus enhance the signal-to-noise ratio (SNR).
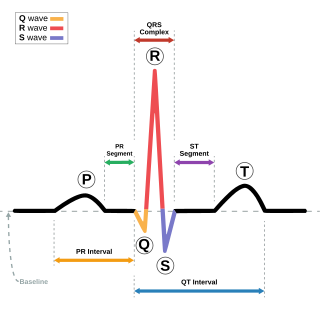
The Pan–Tompkins algorithm is commonly used to detect QRS complexes in electrocardiographic signals (ECG). The QRS complex represents the ventricular depolarization and the main spike visible in an ECG signal. This feature makes it particularly suitable for measuring heart rate, the first way to assess the heart health state. In the first derivation of Einthoven of a physiological heart, the QRS complex is composed by a downward deflection, a high upward deflection and a final downward deflection.
Seismic data acquisition is the first of the three distinct stages of seismic exploration, the other two being seismic data processing and seismic interpretation. Seismic acquisition requires the use of a seismic source at specified locations for a seismic survey, and the energy that travels within the subsurface as seismic waves generated by the source gets recorded at specified locations on the surface by what is known as receivers.
