
Ductility is a mechanical property commonly described as a material's amenability to drawing. In materials science, ductility is defined by the degree to which a material can sustain plastic deformation under tensile stress before failure. Ductility is an important consideration in engineering and manufacturing. It defines a material's suitability for certain manufacturing operations and its capacity to absorb mechanical overload. Some metals that are generally described as ductile include gold and copper, while platinum is the most ductile of all metals in pure form. However, not all metals experience ductile failure as some can be characterized with brittle failure like cast iron. Polymers generally can be viewed as ductile materials as they typically allow for plastic deformation.
In engineering, deformation refers to the change in size or shape of an object. Displacements are the absolute change in position of a point on the object. Deflection is the relative change in external displacements on an object. Strain is the relative internal change in shape of an infinitesimally small cube of material and can be expressed as a non-dimensional change in length or angle of distortion of the cube. Strains are related to the forces acting on the cube, which are known as stress, by a stress-strain curve. The relationship between stress and strain is generally linear and reversible up until the yield point and the deformation is elastic. The linear relationship for a material is known as Young's modulus. Above the yield point, some degree of permanent distortion remains after unloading and is termed plastic deformation. The determination of the stress and strain throughout a solid object is given by the field of strength of materials and for a structure by structural analysis.

In engineering and materials science, a stress–strain curve for a material gives the relationship between stress and strain. It is obtained by gradually applying load to a test coupon and measuring the deformation, from which the stress and strain can be determined. These curves reveal many of the properties of a material, such as the Young's modulus, the yield strength and the ultimate tensile strength.
In materials science, superplasticity is a state in which solid crystalline material is deformed well beyond its usual breaking point, usually over about 400% during tensile deformation. Such a state is usually achieved at high homologous temperature. Examples of superplastic materials are some fine-grained metals and ceramics. Other non-crystalline materials (amorphous) such as silica glass and polymers also deform similarly, but are not called superplastic, because they are not crystalline; rather, their deformation is often described as Newtonian fluid. Superplastically deformed material gets thinner in a very uniform manner, rather than forming a "neck" that leads to fracture. Also, the formation of microvoids, which is another cause of early fracture, is inhibited. Superplasticity must not be confused with superelasticity.
Stress–strain analysis is an engineering discipline that uses many methods to determine the stresses and strains in materials and structures subjected to forces. In continuum mechanics, stress is a physical quantity that expresses the internal forces that neighboring particles of a continuous material exert on each other, while strain is the measure of the deformation of the material.

Sheet metal is metal formed into thin, flat pieces, usually by an industrial process. Sheet metal is one of the fundamental forms used in metalworking, and it can be cut and bent into a variety of shapes.

In materials science, work hardening, also known as strain hardening, is the strengthening of a metal or polymer by plastic deformation. Work hardening may be desirable, undesirable, or inconsequential, depending on the context.
Hydroforming is a cost-effective way of shaping ductile metals such as aluminium, brass, low alloy steel, and stainless steel into lightweight, structurally stiff and strong pieces. One of the largest applications of hydroforming is the automotive industry, which makes use of the complex shapes made possible by hydroforming to produce stronger, lighter, and more rigid unibody structures for vehicles. This technique is particularly popular with the high-end sports car industry and is also frequently employed in the shaping of aluminium tubes for bicycle frames.
Dynamic recrystallization (DRX) is a type of recrystallization process, found within the fields of metallurgy and geology. In dynamic recrystallization, as opposed to static recrystallization, the nucleation and growth of new grains occurs during deformation rather than afterwards as part of a separate heat treatment. The reduction of grain size increases the risk of grain boundary sliding at elevated temperatures, while also decreasing dislocation mobility within the material. The new grains are less strained, causing a decrease in the hardening of a material. Dynamic recrystallization allows for new grain sizes and orientation, which can prevent crack propagation. Rather than strain causing the material to fracture, strain can initiate the growth of a new grain, consuming atoms from neighboring pre-existing grains. After dynamic recrystallization, the ductility of the material increases.
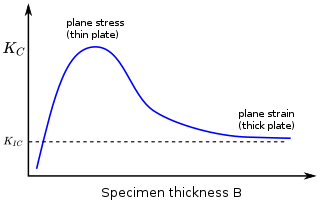
In materials science, fracture toughness is the critical stress intensity factor of a sharp crack where propagation of the crack suddenly becomes rapid and unlimited. A component's thickness affects the constraint conditions at the tip of a crack with thin components having plane stress conditions and thick components having plane strain conditions. Plane strain conditions give the lowest fracture toughness value which is a material property. The critical value of stress intensity factor in mode I loading measured under plane strain conditions is known as the plane strain fracture toughness, denoted . When a test fails to meet the thickness and other test requirements that are in place to ensure plane strain conditions, the fracture toughness value produced is given the designation . Fracture toughness is a quantitative way of expressing a material's resistance to crack propagation and standard values for a given material are generally available.
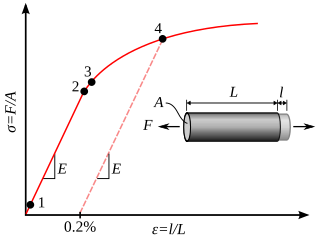
In materials science and engineering, the yield point is the point on a stress-strain curve that indicates the limit of elastic behavior and the beginning of plastic behavior. Below the yield point, a material will deform elastically and will return to its original shape when the applied stress is removed. Once the yield point is passed, some fraction of the deformation will be permanent and non-reversible and is known as plastic deformation.
In materials science, hardness is a measure of the resistance to localized plastic deformation induced by either mechanical indentation or abrasion. In general, different materials differ in their hardness; for example hard metals such as titanium and beryllium are harder than soft metals such as sodium and metallic tin, or wood and common plastics. Macroscopic hardness is generally characterized by strong intermolecular bonds, but the behavior of solid materials under force is complex; therefore, hardness can be measured in different ways, such as scratch hardness, indentation hardness, and rebound hardness. Hardness is dependent on ductility, elastic stiffness, plasticity, strain, strength, toughness, viscoelasticity, and viscosity. Common examples of hard matter are ceramics, concrete, certain metals, and superhard materials, which can be contrasted with soft matter.

Deep drawing is a sheet metal forming process in which a sheet metal blank is radially drawn into a forming die by the mechanical action of a punch. It is thus a shape transformation process with material retention. The process is considered "deep" drawing when the depth of the drawn part exceeds its diameter. This is achieved by redrawing the part through a series of dies.

Shear forming, also referred as shear spinning, is similar to metal spinning. In shear spinning the area of the final piece is approximately equal to that of the flat sheet metal blank. The wall thickness is maintained by controlling the gap between the roller and the mandrel. In shear forming a reduction of the wall thickness occurs.
For sheet metal forming analysis within the metal forming process, a successful technique requires a non-contact optical 3D deformation measuring system. The system analyzes, calculates and documents deformations of sheet metal parts, for example. It provides the 3D coordinates of the component's surface as well as the distribution of major and minor strain on the surface and the material thickness reduction. In the Forming Limit Diagram, the measured deformations are compared to the material characteristics. The system supports optimization processes in sheet metal forming by means of;

Tensile testing, also known as tension testing, is a fundamental materials science and engineering test in which a sample is subjected to a controlled tension until failure. Properties that are directly measured via a tensile test are ultimate tensile strength, breaking strength, maximum elongation and reduction in area. From these measurements the following properties can also be determined: Young's modulus, Poisson's ratio, yield strength, and strain-hardening characteristics. Uniaxial tensile testing is the most commonly used for obtaining the mechanical characteristics of isotropic materials. Some materials use biaxial tensile testing. The main difference between these testing machines being how load is applied on the materials.
Formability is the ability of a given metal workpiece to undergo plastic deformation without being damaged. The plastic deformation capacity of metallic materials, however, is limited to a certain extent, at which point, the material could experience tearing or fracture (breakage).
Polymer fracture is the study of the fracture surface of an already failed material to determine the method of crack formation and extension in polymers both fiber reinforced and otherwise. Failure in polymer components can occur at relatively low stress levels, far below the tensile strength because of four major reasons: long term stress or creep rupture, cyclic stresses or fatigue, the presence of structural flaws and stress-cracking agents. Formations of submicroscopic cracks in polymers under load have been studied by x ray scattering techniques and the main regularities of crack formation under different loading conditions have been analyzed. The low strength of polymers compared to theoretically predicted values are mainly due to the many microscopic imperfections found in the material. These defects namely dislocations, crystalline boundaries, amorphous interlayers and block structure can all lead to the non-uniform distribution of mechanical stress.
Today the metal forming industry is making increasing use of simulation to evaluate the performing of dies, processes and blanks prior to building try-out tooling. Finite element analysis (FEA) is the most common method of simulating sheet metal forming operations to determine whether a proposed design will produce parts free of defects such as fracture or wrinkling.

In metallurgy, peening is the process of working a metal's surface to improve its material properties, usually by mechanical means, such as hammer blows, by blasting with shot, focusing light, or in recent years, with water column impacts and cavitation jets. With the notable exception of laser peening, peening is normally a cold work process tending to expand the surface of the cold metal, thus inducing compressive stresses or relieving tensile stresses already present. It can also encourage strain hardening of the surface metal.

