Related Research Articles

The Lower Mainland is a geographic and cultural region of the mainland coast of British Columbia that generally comprises the regional districts of Metro Vancouver and the Fraser Valley. Home to approximately 3.05 million people as of the 2021 Canadian census, the Lower Mainland contains sixteen of the province's 30 most populous municipalities and approximately 60% of the province's total population.
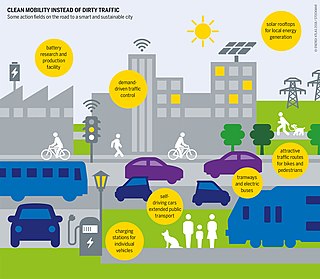
Sustainable transport refers to ways of transportation that are sustainable in terms of their social and environmental impacts. Components for evaluating sustainability include the particular vehicles used for road, water or air transport; the source of energy; and the infrastructure used to accommodate the transport. Transport operations and logistics as well as transit-oriented development are also involved in evaluation. Transportation sustainability is largely being measured by transportation system effectiveness and efficiency as well as the environmental and climate impacts of the system. Transport systems have significant impacts on the environment, accounting for between 20% and 25% of world energy consumption and carbon dioxide emissions. The majority of the emissions, almost 97%, came from direct burning of fossil fuels. In 2019, about 95% of the fuel came from fossil sources. The main source of greenhouse gas emissions in the European Union is transportation. In 2019 it contributes to about 31% of global emissions and 24% of emissions in the EU. In addition, up to the COVID-19 pandemic, emissions have only increased in this one sector. Greenhouse gas emissions from transport are increasing at a faster rate than any other energy using sector. Road transport is also a major contributor to local air pollution and smog.

The Fraser Valley Regional District (FVRD) is a regional district in British Columbia, Canada. Its headquarters are in the city of Chilliwack. The FVRD covers an area of 13,361.74 km2 (5,159 sq mi). It was created in 1995 by an amalgamation of the Fraser-Cheam Regional District and Central Fraser Valley Regional District and the portion of the Dewdney-Alouette Regional District from and including the District of Mission eastwards.

A carbon footprint (or greenhouse gas footprint) is a calculated value or index that makes it possible to compare the total amount of greenhouse gases that an activity, product, company or country adds to the atmosphere. Carbon footprints are usually reported in tonnes of emissions (CO2-equivalent) per unit of comparison. Such units can be for example tonnes CO2-eq per year, per kilogram of protein for consumption, per kilometer travelled, per piece of clothing and so forth. A product's carbon footprint includes the emissions for the entire life cycle. These run from the production along the supply chain to its final consumption and disposal.

Carbon offsetting is a carbon trading mechanism that enables entities such as governments or businesses to compensate for (i.e. “offset”) their greenhouse gas emissions by investing in projects that reduce, avoid, or remove emissions elsewhere. When an entity invests in a carbon offsetting program, it receives carbon credits. These "tokens" are then used to account for net climate benefits from one entity to another. A carbon credit or offset credit can be bought or sold after certification by a government or independent certification body. One carbon offset or credit represents a reduction, avoidance or removal of one metric Tonne of carbon dioxide or its carbon dioxide-equivalent (CO2e).
A sustainable city, eco-city, or green city is a city designed with consideration for social, economic, environmental impact, and resilient habitat for existing populations, without compromising the ability of future generations to experience the same. The UN Sustainable Development Goal 11 defines sustainable cities as those that are dedicated to achieving green sustainability, social sustainability and economic sustainability. They are committed to doing so by enabling opportunities for all through a design focused on inclusivity as well as maintaining a sustainable economic growth. The focus will also includes minimizing required inputs of energy, water, and food, and drastically reducing waste, output of heat, air pollution – CO2, methane, and water pollution. Richard Register, a visual artist, first coined the term ecocity in his 1987 book Ecocity Berkeley: Building Cities for a Healthy Future, where he offers innovative city planning solutions that would work anywhere. Other leading figures who envisioned sustainable cities are architect Paul F Downton, who later founded the company Ecopolis Pty Ltd, as well as authors Timothy Beatley and Steffen Lehmann, who have written extensively on the subject. The field of industrial ecology is sometimes used in planning these cities.
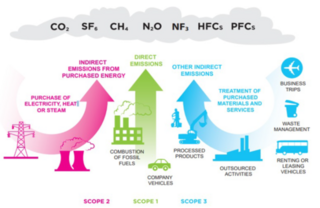
Carbon accounting is a framework of methods to measure and track how much greenhouse gas (GHG) an organization emits. It can also be used to track projects or actions to reduce emissions in sectors such as forestry or renewable energy. Corporations, cities and other groups use these techniques to help limit climate change. Organizations will often set an emissions baseline, create targets for reducing emissions, and track progress towards them. The accounting methods enable them to do this in a more consistent and transparent manner.
The Global Warming Solutions Act of 2006, or Assembly Bill (AB) 32, is a California state law that fights global warming by establishing a comprehensive program to reduce greenhouse gas emissions from all sources throughout the state. AB32 was co-authored by Assemblymember Fran Pavley and Speaker of the California Assembly Fabian Nunez and signed into law by Governor Arnold Schwarzenegger on September 27, 2006.

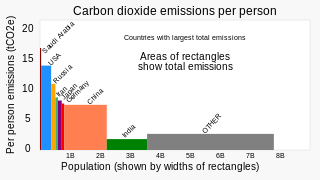
Greenhouse gas (GHG) emissions from human activities intensify the greenhouse effect. This contributes to climate change. Carbon dioxide, from burning fossil fuels such as coal, oil, and natural gas, is one of the most important factors in causing climate change. The largest emitters are China followed by the United States. The United States has higher emissions per capita. The main producers fueling the emissions globally are large oil and gas companies. Emissions from human activities have increased atmospheric carbon dioxide by about 50% over pre-industrial levels. The growing levels of emissions have varied, but have been consistent among all greenhouse gases. Emissions in the 2010s averaged 56 billion tons a year, higher than any decade before. Total cumulative emissions from 1870 to 2017 were 425±20 GtC from fossil fuels and industry, and 180±60 GtC from land use change. Land-use change, such as deforestation, caused about 31% of cumulative emissions over 1870–2017, coal 32%, oil 25%, and gas 10%.
FortisBC is a Canadian owned, British Columbia based regulated utility providing natural gas, and electricity. FortisBC has approximately 2,600 employees serving more than 1.2 million customers in 135 B.C. communities and 58 First Nations communities across 150 Traditional Territories.
The United States produced 5.2 billion metric tons of carbon dioxide equivalent greenhouse gas (GHG) emissions in 2020, the second largest in the world after greenhouse gas emissions by China and among the countries with the highest greenhouse gas emissions per person. In 2019 China is estimated to have emitted 27% of world GHG, followed by the United States with 11%, then India with 6.6%. In total the United States has emitted a quarter of world GHG, more than any other country. Annual emissions are over 15 tons per person and, amongst the top eight emitters, is the highest country by greenhouse gas emissions per person. However, the IEA estimates that the richest decile in the US emits over 55 tonnes of CO2 per capita each year. Because coal-fired power stations are gradually shutting down, in the 2010s emissions from electricity generation fell to second place behind transportation which is now the largest single source. In 2020, 27% of the GHG emissions of the United States were from transportation, 25% from electricity, 24% from industry, 13% from commercial and residential buildings and 11% from agriculture.

Canada was active in the negotiations that led to the Kyoto Protocol in 1997. The Liberal government that signed the accord in 1997 ratified it in parliament in 2002. Canada's Kyoto target was a 6% total reduction in greenhouse gas (GHG) emissions by 2012, compared to 1990 levels of 461 megatonnes (Mt). Despite signing the accord, greenhouse gas emissions increased approximately 24.1% between 1990 and 2008. In 2011, Conservative Prime Minister Stephen Harper withdrew Canada from the Kyoto Protocol.

A low-carbon fuel standard (LCFS) is an emissions trading rule designed to reduce the average carbon intensity of transportation fuels in a given jurisdiction, as compared to conventional petroleum fuels, such as gasoline and diesel. The most common methods for reducing transportation carbon emissions are supplying electricity to electric vehicles, supplying hydrogen fuel to fuel cell vehicles and blending biofuels, such as ethanol, biodiesel, renewable diesel, and renewable natural gas into fossil fuels. The main purpose of a low-carbon fuel standard is to decrease carbon dioxide emissions associated with vehicles powered by various types of internal combustion engines while also considering the entire life cycle, in order to reduce the carbon footprint of transportation.
Climate change in Canada has had large impacts on the country's environment and landscapes. These events are likely to become even more frequent and severe in the future due to the continued release of greenhouse gases into the atmosphere. The number of climate change–related events, such as the 2021 British Columbia Floods and an increasing number of forest fires, has become an increasing concern over time. Canada's annual average temperature over land has warmed by 1.7 degrees Celsius since 1948. The rate of warming is even higher in Canada's north, the Prairies, and northern British Columbia. The country's precipitation has increased in recent years and extreme weather events have become more common.
The climate change policy of the United States has major impacts on global climate change and global climate change mitigation. This is because the United States is the second largest emitter of greenhouse gasses in the world after China, and is among the countries with the highest greenhouse gas emissions per person in the world. In total, the United States has emitted over a trillion metric tons of greenhouse gasses, more than any country in the world.
Prospective Outlook on Long-term Energy Systems (POLES) is a world simulation model for the energy sector that runs on the Vensim software. It is a techno-economic model with endogenous projection of energy prices, a complete accounting of energy demand and supply of numerous energy vectors and associated technologies, and a carbon dioxide and other greenhouse gases emissions module.
A climate change scenario is a hypothetical future based on a "set of key driving forces". Scenarios explore the long-term effectiveness of mitigation and adaptation. Scenarios help to understand what the future may hold. They can show which decisions will have the most meaningful effects on mitigation and adaptation.
The Sustainable Communities and Climate Protection Act of 2008, also known as Senate Bill 375 or SB 375, is a State of California law targeting greenhouse gas emissions from passenger vehicles. The Global Warming Solutions Act of 2006 sets goals for the reduction of statewide greenhouse gas emissions. Passenger vehicles are the single largest source of greenhouse gas emissions statewide, accounting for 30% of total emissions. SB 375 therefore provides key support to achieve the goals of AB 32.

Deforestation in British Columbia has resulted in a net loss of 1.06 million hectares of tree cover between the years 2000 and 2020. More traditional losses have been exacerbated by increased threats from climate change driven fires, increased human activity, and invasive species. The introduction of sustainable forestry efforts such as the Zero Net Deforestation Act seeks to reduce the rate of forest cover loss. In British Columbia, forests cover over 55 million hectares, which is 57.9% of British Columbia's 95 million hectares of land. The forests are mainly composed of coniferous trees, such as pines, spruces and firs.
China's greenhouse gas emissions are the largest of any country in the world both in production and consumption terms, and stem mainly from coal burning, including coal power, coal mining, and blast furnaces producing iron and steel. When measuring production-based emissions, China emitted over 14 gigatonnes (Gt) CO2eq of greenhouse gases in 2019, 27% of the world total. When measuring in consumption-based terms, which adds emissions associated with imported goods and extracts those associated with exported goods, China accounts for 13 gigatonnes (Gt) or 25% of global emissions.
References
- ↑ "Case Study by the Government of BC" (PDF). Archived from the original (PDF) on 2011-07-06. Retrieved 2012-07-31.
- ↑ "Comparison with other models". Archived from the original on 2011-11-17. Retrieved 2012-07-31.
- ↑ Dalhousie University Thesis Project analysing GHGProof and another model
- ↑ Detailed comparison of GHG models by Government of BC [ permanent dead link ]
- ↑ "The GHG Implications of Different Settlement Patterns on Salt Spring Island" (PDF). Archived from the original (PDF) on 2010-12-19. Retrieved 2012-07-31.
- ↑ BC Government's Climate Change Policies
- ↑ Municipal World Article: Addressing Climate Change [ permanent dead link ]
- ↑ "GHGProof with an interactive skin for a small community". Archived from the original on 2014-07-14. Retrieved 2012-07-31.