
In geography, latitude is a geographic coordinate that specifies the north–south position of a point on the Earth's surface. Latitude is an angle which ranges from 0° at the Equator to 90° at the poles. Lines of constant latitude, or parallels, run east–west as circles parallel to the equator. Latitude is used together with longitude to specify the precise location of features on the surface of the Earth. On its own, the term latitude should be taken to be the geodetic latitude as defined below. Briefly, geodetic latitude at a point is the angle formed by the vector perpendicular to the ellipsoidal surface from that point, and the equatorial plane. Also defined are six auxiliary latitudes that are used in special applications.

The Mercator projection is a cylindrical map projection presented by Flemish geographer and cartographer Gerardus Mercator in 1569. It became the standard map projection for navigation because it is unique in representing north as up and south as down everywhere while preserving local directions and shapes. The map is thereby conformal. As a side effect, the Mercator projection inflates the size of objects away from the equator. This inflation is very small near the equator but accelerates with increasing latitude to become infinite at the poles. As a result, landmasses such as Greenland and Antarctica appear far larger than they actually are relative to landmasses near the equator, such as Central Africa.

Weather is the state of the atmosphere, describing for example the degree to which it is hot or cold, wet or dry, calm or stormy, clear or cloudy. On Earth, most weather phenomena occur in the lowest layer of the planet's atmosphere, the troposphere, just below the stratosphere. Weather refers to day-to-day temperature, precipitation, and other atmospheric conditions, whereas climate is the term for the averaging of atmospheric conditions over longer periods of time. When used without qualification, "weather" is generally understood to mean the weather of Earth.

The troposphere is the first and lowest layer of the atmosphere of the Earth, and contains 75% of the total mass of the planetary atmosphere, 99% of the total mass of water vapour and aerosols, and is where most weather phenomena occur. From the planetary surface of the Earth, the average height of the troposphere is 18 km in the tropics; 17 km in the middle latitudes; and 6 km in the high latitudes of the polar regions in winter; thus the average height of the troposphere is 13 km.
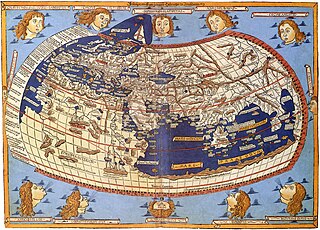
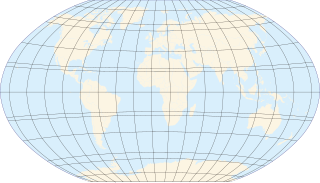
In cartography, map projection is the term used to describe a broad set of transformations employed to represent the two-dimensional curved surface of a globe on a plane. In a map projection, coordinates, often expressed as latitude and longitude, of locations from the surface of the globe are transformed to coordinates on a plane. Projection is a necessary step in creating a two-dimensional map and is one of the essential elements of cartography.
A circle of latitude or line of latitude on Earth is an abstract east–west small circle connecting all locations around Earth at a given latitude coordinate line.
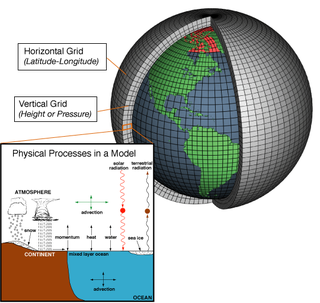
A general circulation model (GCM) is a type of climate model. It employs a mathematical model of the general circulation of a planetary atmosphere or ocean. It uses the Navier–Stokes equations on a rotating sphere with thermodynamic terms for various energy sources. These equations are the basis for computer programs used to simulate the Earth's atmosphere or oceans. Atmospheric and oceanic GCMs are key components along with sea ice and land-surface components.

In navigation, a rhumb line, rhumb, or loxodrome is an arc crossing all meridians of longitude at the same angle, that is, a path with constant bearing as measured relative to true north.
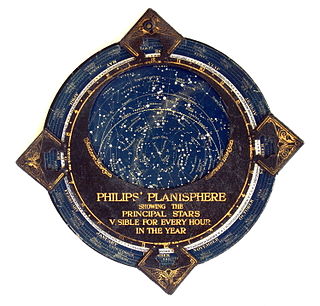
In astronomy, a planisphere is a star chart analog computing instrument in the form of two adjustable disks that rotate on a common pivot. It can be adjusted to display the visible stars for any time and date. It is an instrument to assist in learning how to recognize stars and constellations. The astrolabe, an instrument that has its origins in Hellenistic astronomy, is a predecessor of the modern planisphere. The term planisphere contrasts with armillary sphere, where the celestial sphere is represented by a three-dimensional framework of rings.
The haversine formula determines the great-circle distance between two points on a sphere given their longitudes and latitudes. Important in navigation, it is a special case of a more general formula in spherical trigonometry, the law of haversines, that relates the sides and angles of spherical triangles.

The equirectangular projection, and which includes the special case of the plate carrée projection, is a simple map projection attributed to Marinus of Tyre, who Ptolemy claims invented the projection about AD 100. The projection maps meridians to vertical straight lines of constant spacing, and circles of latitude to horizontal straight lines of constant spacing. The projection is neither equal area nor conformal. Because of the distortions introduced by this projection, it has little use in navigation or cadastral mapping and finds its main use in thematic mapping. In particular, the plate carrée has become a standard for global raster datasets, such as Celestia, NASA World Wind, and Natural Earth, because of the particularly simple relationship between the position of an image pixel on the map and its corresponding geographic location on Earth. In addition it is frequently used in panoramic photography to represent a spherical panoramic image.

An orbital pole is either point at the ends of an imaginary line segment that runs through the center of an orbit and is perpendicular to the orbital plane. Projected onto the celestial sphere, orbital poles are similar in concept to celestial poles, but are based on the body's orbit instead of its equator.

A geodesic grid is a spatial grid based on a geodesic polyhedron or Goldberg polyhedron.
Geohash is a public domain geocode system invented in 2008 by Gustavo Niemeyer which encodes a geographic location into a short string of letters and digits. Similar ideas were introduced by G.M. Morton in 1966. It is a hierarchical spatial data structure which subdivides space into buckets of grid shape, which is one of the many applications of what is known as a Z-order curve, and generally space-filling curves.
In geodesy and navigation, a meridian arc is the curve between two points on the Earth's surface having the same longitude. The term may refer either to a segment of the meridian, or to its length.

Geographical distance is the distance measured along the surface of the earth. The formulae in this article calculate distances between points which are defined by geographical coordinates in terms of latitude and longitude. This distance is an element in solving the second (inverse) geodetic problem.
The Equator is a circle of latitude, about 40,075 km (24,901 mi) in circumference, that divides Earth into the Northern and Southern hemispheres. It is an imaginary line located at 0 degrees latitude, halfway between the North and South poles.
Ocean general circulation models (OGCMs) are a particular kind of general circulation model to describe physical and thermodynamical processes in oceans. The oceanic general circulation is defined as the horizontal space scale and time scale larger than mesoscale. They depict oceans using a three-dimensional grid that include active thermodynamics and hence are most directly applicable to climate studies. They are the most advanced tools currently available for simulating the response of the global ocean system to increasing greenhouse gas concentrations. A hierarchy of OGCMs have been developed that include varying degrees of spatial coverage, resolution, geographical realism, process detail, etc.
A Discrete Global Grid (DGG) is a mosaic which covers the entire Earth's surface. Mathematically it is a space partitioning: it consists of a set of non-empty regions that form a partition of the Earth's surface. In a usual grid-modeling strategy, to simplify position calculations, each region is represented by a point, abstracting the grid as a set of region-points. Each region or region-point in the grid is called a cell.

Solar phenomena are the natural phenomena occurring within the outer atmosphere of the Sun. These phenomena take many forms, including solar wind, radio wave flux, solar flares, coronal mass ejections, coronal heating and sunspots.
