John W. Oxendine is an American politician who served four terms as Insurance Commissioner of the U.S. state of Georgia. A member of the Republican party, he was first elected commissioner in 1994 and was reelected in 1998, 2002, and 2006. Prior to entering politics, Oxendine owned and operated a small business and was a lawyer practicing in Gwinnett County, Georgia.

The 2010 South Carolina gubernatorial election took place on November 2, 2010. Incumbent Republican Governor Mark Sanford was term limited and unable to seek re-election. Primary elections took place on June 8, 2010 and a runoff election, as was necessary on the Republican side, was held two weeks later on June 22.

United States gubernatorial elections were held on November 2, 2010 in 37 states and two territories. As in most midterm elections, the party controlling the White House lost ground. Democrats did take five governorships from the Republicans, and Republicans took 11 governorships from the Democrats. An independent won one governorship previously held by a Republican. A Republican won one governorship previously held by an independent. Republicans held a majority of governorships for the first time since before the 2006 elections. One state, Louisiana, had no election for governor, but did feature a special election for lieutenant governor.
The following table indicates the party of elected officials in the U.S. state of Georgia:

The Michigan gubernatorial election of 2010 was held on November 2, 2010. Incumbent Democratic Governor Jennifer Granholm was prohibited by the state's Constitution from seeking a third term. This resulted in a large pool of candidates which was whittled down, when the May 11 filing deadline passed, to two Democrats and five Republicans. Both the Cook Political Report and the non-partisan Rothenberg Political Report rated the election as leaning Republican.

The 2010 Illinois gubernatorial election took place on November 2, 2010. Incumbent Democratic Governor Pat Quinn sought and was elected to a full term in office. Quinn was elected as the Democratic nominee, the Illinois Green Party nominee was attorney and 2006 nominee Rich Whitney, the Republican nominee was State Senator Bill Brady, the Libertarian Party nominee was Lex Green, and Scott Lee Cohen ran as an independent. Governor Quinn won election to a full term in a very close race, beating Senator Brady by only about 32,000 votes, despite Brady winning in 98 of 102 Illinois counties.
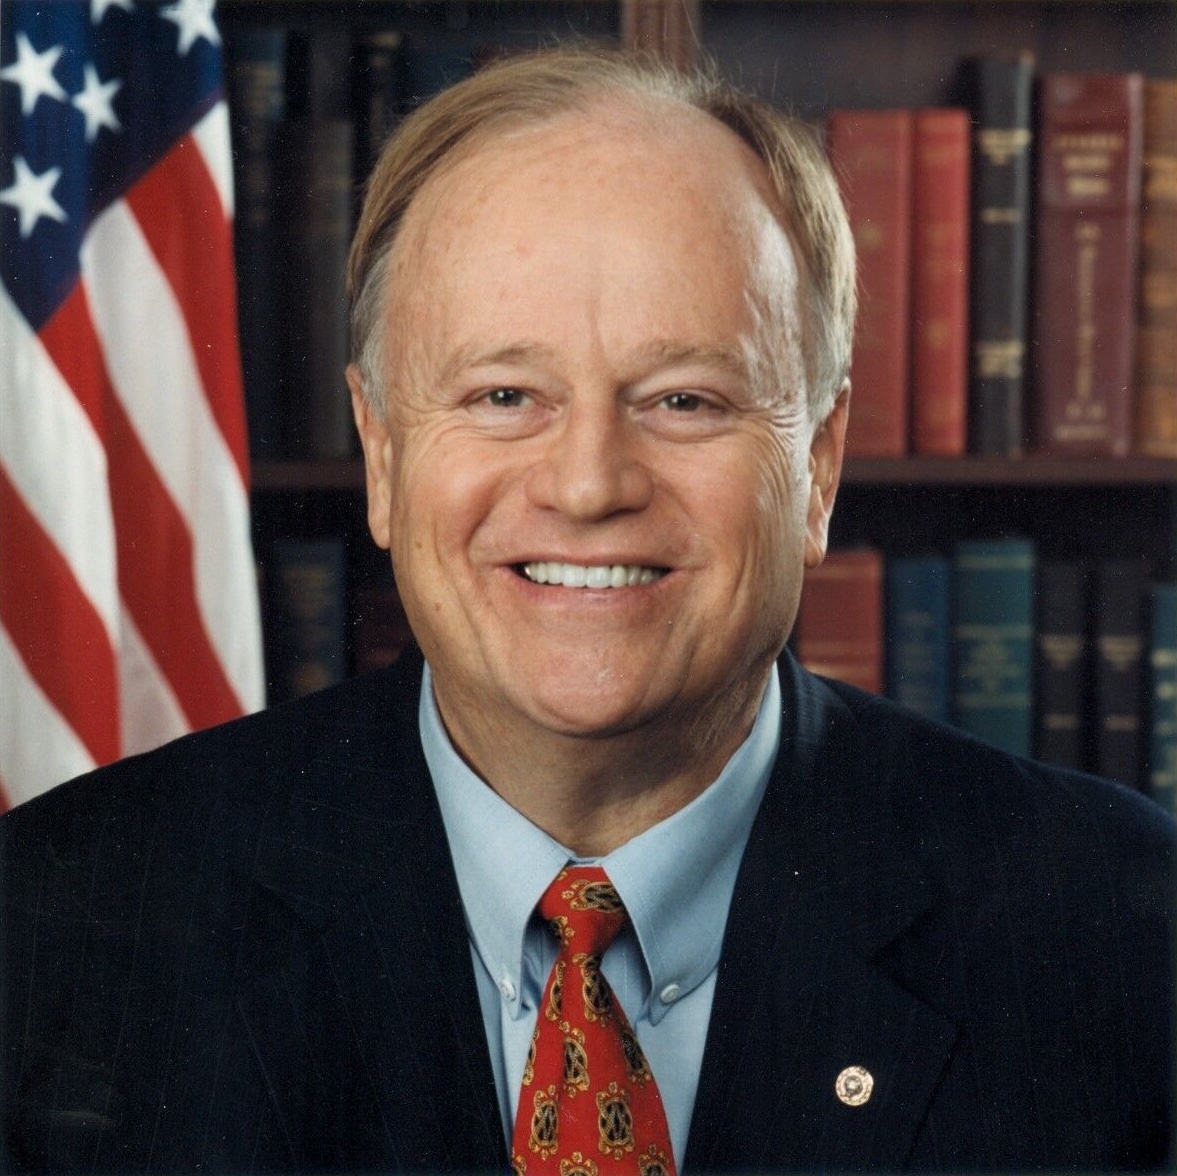
The 1996 United States Senate election in Georgia was held on November 5, 1996. Incumbent Democratic United States Senator Sam Nunn decided to retire instead of seeking a fifth term. The Republican Party nominated Guy Millner, a multi-millionaire businessman who was also the unsuccessful candidate who ran against Zell Miller in the 1994 gubernatorial election. Millner emerged as the victor from a crowded 6-person primary in July 1996. However, Max Cleland, the Secretary of State of Georgia ran unopposed in the Democratic primary.
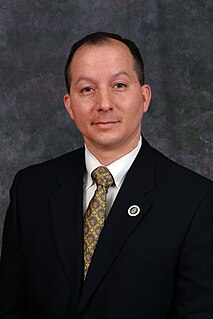
Richard Jason Satawk "R. J." Harris is a United States Army National Guard warrant officer, politician, law student and former Air Traffic Controller. He was a candidate for the Libertarian Party's 2012 nomination for President of the United States. In 2010, he unsuccessfully challenged incumbent Tom Cole for the Republican Party nomination in the primary election for Oklahoma's 4th congressional district. He ran as an independent candidate for the same congressional seat in 2012.
The 2010 Georgia statewide elections were held on November 2, 2010 in the U.S. state of Georgia. The primary elections were held on July 20. Primary contests in which no single candidate received a majority of the vote were decided in a runoff election on August 10.

The 2012 Indiana gubernatorial election took place on November 6, 2012. Incumbent governor Mitch Daniels was term-limited and unable to seek a third term. The Republican candidate, Congressman Mike Pence; the Democratic candidate, former Speaker of the Indiana House of Representatives John R. Gregg; and the Libertarian candidate, youth mentor, small business owner and reality TV personality, Rupert Boneham, were all unopposed in their respective primaries or conventions and contested the general election.

The 2012 North Dakota gubernatorial election was held on November 6, 2012, to elect a governor and lieutenant governor of North Dakota. Incumbent Governor Jack Dalrymple succeeded to the office when then-Governor John Hoeven resigned to take a seat in the United States Senate. Dalrymple, a member of the Republican Party, won election to a first full term. Ryan Taylor was the Democratic nominee. Jack Dalrymple prevailed with 63% of the vote.

The 2012 West Virginia gubernatorial election was held on November 6, 2012, to elect the governor of West Virginia. Democratic incumbent Earl Ray Tomblin, who was elected governor in a special election in 2011, was elected to a full four-year term. The election was a rematch of the 2011 special election.

The 2014 Minnesota gubernatorial election took place on November 4, 2014, to elect the governor of Minnesota concurrently with the election to Minnesota's Class II U.S. Senate seat, as well as other elections to the United States Senate in other states and elections to the United States House of Representatives and various state and local elections.

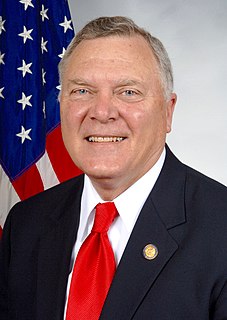
The 2014 Georgia gubernatorial election took place on November 4, 2014, to elect the Governor of Georgia, concurrently with the election to Georgia's Class II U.S. Senate seat, as well as other elections to the United States Senate in other states and elections to the United States House of Representatives and various state and local elections.

The 2016 United States Senate election in Georgia was held November 8, 2016, to elect a member of the United States Senate to represent the State of Georgia, concurrently with the 2016 U.S. presidential election, as well as other elections to the United States Senate in other states and elections to the United States House of Representatives and various state and local elections. The primary election for the Republican and Democratic parties took place on May 24, 2016.

United States gubernatorial elections were held on November 6, 2018 in 36 states and three territories. These elections formed part of the 2018 United States elections. Other coinciding elections were the 2018 United States Senate elections and the 2018 United States House of Representatives elections. The last regular gubernatorial elections for all but three of the states took place in 2014. Governors in New Hampshire and Vermont serve two-year terms, meaning that their most recent gubernatorial elections took place in 2016. Meanwhile, Oregon held a special election in 2016 to fill an unexpired term.