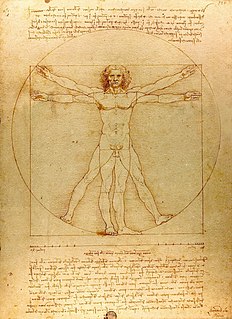
Drawing is a form of visual art in which an artist uses instruments to mark paper or other two-dimensional surface. Drawing instruments include graphite pencils, pen and ink, various kinds of paints, inked brushes, colored pencils, crayons, charcoal, chalk, pastels, erasers, markers, styluses, and metals. Digital drawing is the act of drawing on graphics software in a computer. Common methods of digital drawing include a stylus or finger on a touchscreen device, stylus- or finger-to-touchpad, or in some cases, a mouse. There are many digital art programs and devices.

Graphic design is the profession and academic discipline whose activity consists in projecting visual communications intended to transmit specific messages to social groups, with specific objectives. Design is based on the principle of "form follows a specific function".

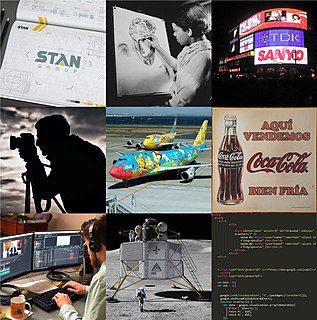
Commercial art is the art of creative services, referring to art created for commercial purposes, primarily advertising. Commercial art uses a variety of platforms for viewers with the intent of promoting sale and interest of products, services, and ideas. It relies on the iconic image to enhance recall and favorable recognition for a product or service. An example of a product could be a magazine ad promoting a new soda through complementary colors, a catchy message, and appealing illustrative features. Another example could be promoting the prevention of global warming by encouraging people to walk or ride a bike instead of driving in an eye catching poster. It communicates something specific to an audience.
Facilitation in business, organizational development (OD), and in consensus decision-making refers to the process of designing and running a meeting according to a previously agreed set of requirements.
Visual effects is the process by which imagery is created or manipulated outside the context of a live-action shot in filmmaking and video production. The integration of live-action footage and other live-action footage or CGI elements to create realistic imagery is called VFX.
Chris Argyris was an American business theorist and professor emeritus at Harvard Business School. Argyris, like Richard Beckhard, Edgar Schein and Warren Bennis, is known as a co-founder of organization development, and known for seminal work on learning organizations.
Graphics are visual images or designs on some surface, such as a wall, canvas, screen, paper, or stone, to inform, illustrate, or entertain. In contemporary usage, it includes a pictorial representation of data, as in design and manufacture, in typesetting and the graphic arts, and in educational and recreational software. Images that are generated by a computer are called computer graphics.

A category of fine art, graphic art covers a broad range of visual artistic expression, typically two-dimensional, i.e. produced on a flat surface. The term usually refers to the arts that rely more on line or tone than on colour, especially drawing and the various forms of engraving; it is sometimes understood to refer specifically to printmaking processes, such as line engraving, aquatint, drypoint, etching, mezzotint, monotype, lithography, and screen printing. Graphic art further includes calligraphy, photography, painting, typography, computer graphics, and bindery. It also encompasses drawn plans and layouts for interior and architectural designs.

Motion graphic design, also known as motion design, is a subset of graphic design in that it uses graphic design principles in a filmmaking or video production context through the use of animation or filmic techniques. Examples include the kinetic typography and graphics used in film and television opening sequences, and the spinning, three-dimensional station identification logos of some television channels. This art form has been around for decades, and has advanced in technical sophistication over time.

Graphic art software is a subclass of application software used for graphic design, multimedia development, stylized image development, technical illustration, general image editing, or simply to access graphic files. Art software uses either raster or vector graphic reading and editing methods to create, edit, and view art.
Robert Kegan is an American developmental psychologist. He is a licensed psychologist and practicing therapist, lectures to professional and lay audiences, and consults in the area of professional development and organization development.
Graphic design careers include creative director, art director, art production manager, brand identity developer, illustrator and layout artist.

Data visualization is an interdisciplinary field that deals with the graphic representation of data. It is a particularly efficient way of communicating when the data is numerous as for example a time series.

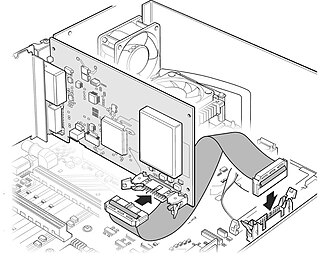
Technical Illustration is illustration meant to visually communicate information of a technical nature. Technical illustrations can be components of technical drawings or diagrams. Technical illustrations in general aim "to generate expressive images that effectively convey certain information via the visual channel to the human observer".

A facilitator is a person who helps a group of people to work together better, understand their common objectives, and plan how to achieve these objectives, during meetings or discussions. In doing so, the facilitator remains "neutral", meaning they do not take a particular position in the discussion. Some facilitator tools will try to assist the group in achieving a consensus on any disagreements that preexist or emerge in the meeting so that it has a solid basis for future action.

Graphic communication as the name suggests is communication using graphic elements. These elements include symbols such as glyphs and icons, images such as drawings and photographs, and can include the passive contributions of substrate, colour and surroundings. It is the process of creating, producing, and distributing material incorporating words and images to convey data, concepts, and emotions.

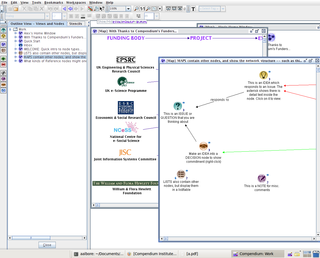
Compendium is a computer program and social science tool that facilitates the mapping and management of ideas and arguments. The software provides a visual environment that allows people to structure and record collaboration as they discuss and work through "wicked problems".
Intergroup dialogue is a "face-to-face facilitated conversation between members of two or more social identity groups that strives to create new levels of understanding, relating, and action". This process promotes conversation around controversial issues, specifically, in order to generate new "collective visions" that uphold the dignity of all people. Intergroup dialogue is based in the philosophies of the democratic and popular education movements. It is commonly used on college campuses, but may assume different namesakes in other settings.

Problem structuring methods (PSMs) are a group of techniques used to model or to map the nature or structure of a situation or state of affairs that some people want to change. PSMs are usually used by a group of people in collaboration to create a consensus about, or at least to facilitate negotiations about, what needs to change. Some widely adopted PSMs include soft systems methodology, the strategic choice approach, and strategic options development and analysis (SODA).

Sketchnoting, also commonly referred to as visual notetaking, is the creative and graphic process through which an individual can record their thoughts with the use of illustrations, symbols, structures, and texts. By combining graphics with the traditional method of using text, the result is information that is captured and communicated visually and artistically. Sketchnoting can be used in a variety of settings and scenarios, such as at conferences, work meetings, classes in school, sporting events, and more. Some elements associated with sketchnoting techniques include using text, emphasized text, basic shapes, containers, connectors, icons and symbols, and sketches and illustrations.


