This article needs to be updated. Please help update this article to reflect recent events or newly available information.(March 2017)
Grid parity for solar PV systems around the world Reached grid-parity before 2014 Reached grid-parity after 2014 Reached grid-parity only for peak prices U.S. states poised to reach grid-parity Source: Deutsche Bank, as of February 2015 (see file description)
Grid parity (or socket parity) occurs when an alternative energy source can generate power at a levelized cost of electricity (LCOE) that is less than or equal to the price of power from the electricity grid. The term is most commonly used when discussing renewable energy sources, notably solar power and wind power. Grid parity depends upon whether you are calculating from the point of view of a utility or of a retail consumer.[1]
Reaching grid parity is considered to be the point at which an energy source becomes a contender for widespread development without subsidies or government support. It is widely believed that a wholesale shift in generation to these forms of energy will take place when they reach grid parity.
Germany was one of the first countries to reach parity for solar PV in 2011 and 2012 for utility-scale solar and rooftop solar PV, respectively.[2]:11 By January 2014, grid parity for solar PV systems had already been reached in at least nineteen countries.[3]
Wind power reached grid parity in some places in Europe in the mid 2000s, and has continued to reduce in price.
Overview
The price of electricity from the grid is complex. Most power sources in the developed world are generated in industrial scale plants developed by private or public consortia. The company providing the power and the company delivering that power to the customers are often separate entities who enter into a Power Purchase Agreement that sets a fixed rate for all of the power delivered by the plant. On the other end of the wire, the local distribution company (LDC) charges rates that will cover their power purchases from the variety of producers they use.
This relationship is not straightforward; for instance, an LDC may buy large amounts of base load power from a nuclear plant at a low fixed cost and then buy peaking power only as required from natural gas peakers at a much higher cost, perhaps five to six times. Depending on their billing policy, this might be billed to the customer at a flat rate combining the two rates the LDC pays, or alternately based on a time-based pricing policy that tries to more closely match input costs with customer prices.
As a result of these policies, the exact definition of "grid parity" varies not only from location to location, but customer to customer and even hour to hour.
For instance, wind power connects to the grid on the distribution side (as opposed to the customer side). This means it competes with other large forms of industrial-scale power like hydro, nuclear or coal-fired plants, which are generally inexpensive forms of power. Additionally, the generator will be charged by the distribution operator to carry the power to the markets, adding to their levelized costs.
Solar has the advantage of scaling easily from systems as small as a single solar panel placed on the customer's roof. In this case the system has to compete with the post-delivery retail price, which is generally much higher than the wholesale price at the same time.
It is also important to consider changes in grid pricing when determining whether or not a source is at parity. For instance, the introduction of time-of-use pricing and a general increase in power prices in Mexico during 2010 and 2011 has suddenly resulted in many forms of renewable energy reaching grid parity. A drop in power prices, as has happened in some locations due to the late-2000s recession, can likewise render systems formerly at parity, to be no longer interesting.
In general terms, fuel prices continue to increase, while renewable energy sources continue to reduce in up-front costs. As a result, widespread grid parity for wind and solar were generally predicted for the time between 2015 and 2020.
This section needs to be updated. The reason given is: To many outdated short term forecasts. Please help update this article to reflect recent events or newly available information.(November 2019)
Grid parity is most commonly used in the field of solar power, and most specifically when referring to solar photovoltaics (PV). As PV systems do not use fuel and are largely maintenance-free, the levelized cost of electricity (LCOE) is dominated almost entirely by the capital cost of the system. With the assumption that the discount rate will be similar to the inflation rate of grid power, the levelized cost can be calculated by dividing the original capital cost by the total amount of electricity produced over the system's lifetime.
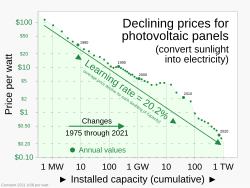
As the LCOE of solar PV is dominated by the capital costs, and the capital costs by the panels, the wholesale prices of PV modules are the main consideration when tracking grid parity. A 2015 study shows price/kWh dropping by 10% per year since 1980, and predicts that solar could contribute 20% of total electricity consumption by 2030, whereas the International Energy Agency predicts 16% by 2050.[7]
The price of electricity from these sources dropped about 25 times between 1990 and 2010. This rate of price reduction accelerated between late-2009 and mid-2011 due to oversupply; the wholesale cost of solar modules dropped approximately 70%.[8] These pressures have demanded efficiencies throughout the construction chain, so total installed cost has also been strongly lowered. Adjusting for inflation, it cost $96 per watt for a solar module in the mid-1970s. Process improvements and a very large boost in production have brought that figure down 99 percent, to 68¢ per watt in February 2016, according to data from Bloomberg New Energy Finance.[9] The downward move in pricing continues. Palo Alto California signed a wholesale purchase agreement in 2016 that secured solar power for 3.7 cents per kilowatt-hour. And in sunny Qatar large-scale solar generated electricity sold in 2020 for just $0.01567 per kWh cheaper than any form of fossil-based electricity.[10]
The average retail price of solar cells as monitored by the Solarbuzz group fell from $3.50/watt to $2.43/watt over the course of 2011, and a decline to prices below $2.00/watt seems inevitable.[11] Solarbuzz tracks retail prices, which includes a large mark-up over wholesale prices, and systems are commonly installed by firms buying at the wholesale price. For this reason, total installation costs are commonly similar to the retail price of the panels alone. Recent total-systems installation costs are around $2500/kWp in Germany[12] or $3,250 in the UK.[13] As of 2011, the capital cost of PV had fallen well below that of nuclear power and was set to fall further.[11]
Knowing the expected production allows the calculation of the LCOE. Modules are generally warranted for 25 years and suffer only minor degradation during that time, so all that is needed to predict the generation is the local insolation. According to PVWattsArchived 18 January 2012 at the Wayback Machine a one-kilowatt system in Matsumoto, Nagano will produce 1187 kilowatt-hour (kWh) of electricity a year. Over a 25-year lifetime, the system will produce about 29,675kWh (not accounting for the small effects of system degradation, about 0.25% a year). If this system costs $5,000 to install ($5 per watt), very conservative compared to worldwide prices, the LCOE = 5,000/29,675 ~= 17 cents per kWh. This is lower than the average Japanese residential rate of ~19.5 cents, which means that, in this simple case which skips the necessary time value of money calculation, PV had reached grid parity for residential users in Japan.
Reaching parity
Deciding whether or not PV is at grid parity is more complex than other sources, due to a side-effect of one of its main advantages. Compared to most sources, like wind turbines or hydro dams, PV can scale successfully to systems as small as one panel or as large as millions. In the case of small systems, they can be installed at the customer's location. In this case the LCOE competes against the retail price of grid power, which includes all upstream additions like transmission fees, taxes, etc. In the example above, grid parity has been reached in Nagano. However, retail prices are generally higher than wholesale prices, so grid parity may not have been reached for the very same system installed on the supply-side of the grid.
In order to encompass all of these possibilities, Japan's NEDO defines the grid parity in three phases:[14]
1st phase grid parity: residential grid-connected PV systems
These categories are ranked in terms of the price of power they displace; residential power is more expensive than commercial wholesale. Thus, it is expected that the 1st phase would be reached earlier than the 3rd phase.
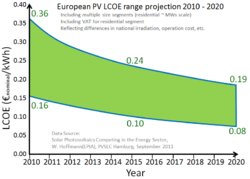
Predictions from the 2006 time-frame expected retail grid parity for solar in the 2016 to 2020 era,[15][16] but due to rapid downward pricing changes, more recent calculations have forced dramatic reductions in time scale, and the suggestion that solar has already reached grid parity in a wide variety of locations.[8] The European Photovoltaic Industry Association (EPIA) calculated that PV would reach parity in many of the European countries by 2020, with costs declining to about half of those of 2010.[4] However, this report was based on the prediction that prices would fall 36 to 51% between 2010 and 2020, a decrease that actually took place during the year the report was authored. The parity line was claimed to have been crossed in Australia in September 2011,[17] and module prices have continued to fall since then.
Stanwell Corporation, an electricity generator owned by the Queensland government made a loss in 2013 from its 4,000MW of coal and gas fired generation. The company attributed this loss to the expansion of rooftop solar generation which reducing the price of electricity during the day, on some days the price per MWh (usually $40–$50 Australian dollars) was almost zero.[18][19]The Australian Government and Bloomberg New Energy Finance forecast the production of energy by rooftop solar to rise sixfold between 2014 and 2024.[19]
Photovoltaics since early-2010s started to compete in some places without subsidies. Shi Zhengrong said that, as of 2012, unsubsidised solar power were already competitive with fossil fuels in India, Hawaii, Italy and Spain. As PV system prices declined it was inevitable that subsidies would end. "Solar power will be able to compete without subsidies against conventional power sources in half the world by 2015".[20][21][needs update] In fact, recent evidence suggest that photovoltaic grid parity has already been reached in countries of the Mediterranean basin (Cyprus).[22]
Predictions that a power source becomes self-supporting when parity is reached appear to be coming true. According to many measures, PV is the fastest growing source of power in the world:
For large-scale installations, prices below $1.00/watt are now common. In some locations, PV has reached grid parity, the cost at which it is competitive with coal or gas-fired generation. More generally, it is now evident that, given a carbon price of $50/ton, which would raise the price of coal-fired power by 5c/kWh, solar PV will be cost-competitive in most locations. The declining price of PV has been reflected in rapidly growing installations, totalling about 23GW in 2011. Although some consolidation is likely in 2012, as firms try to restore profitability, strong growth seems likely to continue for the rest of the decade. Already, by one estimate, total investment in renewables for 2011 exceeded investment in carbon-based electricity generation.[11]
The dramatic price reductions in the PV industry have caused a number of other power sources to become less interesting. Nevertheless, there remained the widespread belief that concentrating solar power (CSP) will be even less expensive than PV, although this is suitable for industrial-scale projects only, and thus has to compete at wholesale pricing. One company stated in 2011 that CSP costs $0.12/kWh to produce in Australia, and expected this to drop to $0.06/kWh by 2015 due to improvements in technology and reductions in equipment manufacturing costs.[23]Greentech Media predicted that LCOE of CSP and PV power would lower to $0.07–$0.12/kWh by 2020 in California.[24]
Wind power
Grid parity also applies to wind power where it varies according to wind quality and existing distribution infrastructure. ExxonMobil predicted in 2011 that wind power real cost would approach parity with natural gas and coal without carbon sequestration and be cheaper than natural gas and coal with carbon sequestration by 2025.[25]
Wind turbines reached grid parity in some areas of Europe in the mid-2000s, and in the US around the same time. Falling prices continue to drive the levelized cost down and it was suggested that it had reached general grid parity in Europe in 2010, and would reach the same point in the US around 2016 due to an expected reduction in capital costs of about 12%.[26] Nevertheless, a significant amount of the wind power resource in North America remained above grid parity due to the long transmission distances involved. (see also OpenEI Database for cost of electricity by source).
↑ J. Doyne Farmer, François Lafond (2 November 2015). "How predictable is technological progress?". Research Policy. 45 (3): 647–665. arXiv:1502.05274. doi:10.1016/j.respol.2015.11.001. S2CID154564641. License: cc. Note: Appendix F. A trend extrapolation of solar energy capacity.
↑ Paris A. Fokaides; Angeliki Kylili (February 2014). "Towards grid parity in insular energy systems: The case of photovoltaics (PV) in Cyprus". Energy Policy. 65: 223–228. doi:10.1016/j.enpol.2013.10.045.
This page is based on this Wikipedia article Text is available under the CC BY-SA 4.0 license; additional terms may apply. Images, videos and audio are available under their respective licenses.