This article is about fall in costs with increased experience in production. For other uses, see Learning curve (disambiguation).
Relationship between experience producing a good and the efficiency of that production
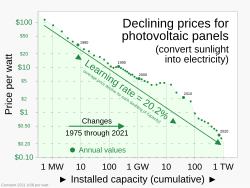
An example of experience curve effects: Swanson's law states that solar module prices have dropped about 20% for each doubling of installed capacity.
In industry, models of the learning or experience curve effect express the relationship between experience producing a good and the efficiency of that production, specifically, efficiency gains that follow investment in the effort. The effect has large implications for costs[3] and market share, which can increase competitive advantage over time.[4]
An early empirical demonstration of learning curves was produced in 1885 by the German psychologist Hermann Ebbinghaus. Ebbinghaus was investigating the difficulty of memorizing verbal stimuli.[5][6] He found that performance increased in proportion to experience (practice and testing) on memorizing the word set. (More detail about the complex processes of learning is discussed in the Learning curve article.)
Wright's law and the discovery of the learning curve effect
This was later more generalized to: The more times a task has been performed, the less time is required on each subsequent iteration. This relationship was probably first quantified in the industrial setting in 1936 by Theodore Paul Wright, an engineer at Curtiss-Wright in the United States.[7] Wright found that every time total aircraft production doubled, the required labor time for a new aircraft fell by 20%. This has become known as "Wright's law". Studies in other industries have yielded different percentage values (ranging from only a couple of percent up to 30%), but in most cases, the value in each industry was a constant percentage and did not vary at different scales of operation. The learning curve model posits that for each doubling of the total quantity of items produced, costs decrease by a fixed proportion. Generally, the production of any good or service shows the learning curve or experience curve effect. Each time cumulative volume doubles, value-added costs (including administration, marketing, distribution, and manufacturing) fall by a constant percentage.
The phrase experience curve was proposed by Bruce D. Henderson, the founder of the Boston Consulting Group (BCG), based on analyses of overall cost behavior in the 1960s.[4] While accepting that the learning curve formed an attractive explanation, he used the name experience curve, suggesting that "the two are related, but quite different."[4] In 1968, Henderson and BCG began to emphasize the implications of the experience curve for strategy.[8] Research by BCG in the 1960s and 70s observed experience curve effects for various industries that ranged from 10% to 25%.[9]
Wright's law unit cost curve
Mathematically, Wright's law takes the form of a power function. Empirical research has validated the following mathematical form for the unit cost Cx of producing the xth unit, starting with unit C1, for a wide variety of products and services:
,
where b is the progress ratio and 1-b = l is the proportion reduction in the unit cost with each doubling in the cumulative production (learning rate). To see this, note the following:
The exponent b is a statistical parameter and thus does not exactly predict the unit cost of producing any future unit. However, it has been found to be useful in many contexts. Across numerous industries (see below), estimates of b range from 0.75 to 0.9 (i.e., 1-b ranges from 0.1 to 0.25).
The unit curve was expressed in slightly different nomenclature by Henderson:[10]
These effects are often expressed graphically. The curve is plotted with the cumulative units produced on the horizontal axis and unit cost on the vertical axis. The BCG group used the value of b to name a given industry curve. Thus a curve showing a 15% cost reduction for every doubling of output was called an "85% experience curve".
A third formulation of Wright's Law is used by a group of innovation investment analysts, working with cumulative average cost per unit and cumulative numbers of units produced.[11]
Reasons for the effect
The primary reason for why experience and learning curve effects apply is the complex processes of learning involved. As discussed in the Learning curve article, learning generally begins with making successively larger finds and then successively smaller ones. The equations for these effects come from the usefulness of mathematical models for certain somewhat predictable aspects of those generally non-deterministic processes.
They include:
Labor efficiency: Workers become physically more dexterous. They become mentally more confident and spend less time hesitating, learning, experimenting, or making mistakes. Over time they learn short-cuts and improvements. This applies to all employees and managers, not just those directly involved in production.
Standardization, specialization, and methods improvements: As processes, parts, and products become more standardized, efficiency tends to increase. When employees specialize in a limited set of tasks, they gain more experience with these tasks and operate at a faster rate.
Technology-driven learning: Automated production technology and information technology can introduce efficiencies as they are implemented and people learn how to use them efficiently and effectively.
Better use of equipment: As total production has increased, manufacturing equipment will have been more fully exploited, lowering fully accounted unit costs. In addition, purchase of more productive equipment can be justifiable.
Changes in the resource mix: As a company acquires experience, it can alter its mix of inputs and thereby become more efficient.
Product redesign: As the manufacturers and consumers have more experience with the product, they can usually find improvements. This filters through to the manufacturing process. A good example of this is Cadillac's testing of various "bells and whistles" specialty accessories. The ones that did not break became mass-produced in other General Motors products; the ones that didn't stand the test of user "beatings" were discontinued, saving the car company money. As General Motors produced more cars, they learned how to best produce products that work for the least money.
Network-building and use-cost reductions (network effects): As a product enters more widespread use, the consumer uses it more efficiently because they're familiar with it. One fax machine in the world can do nothing, but if everyone has one, they build an increasingly efficient network of communications. Another example is email accounts; the more there are, the more efficient the network is, the lower everyone's cost per utility of using it.
Shared experience effects: Experience curve effects are reinforced when two or more products share a common activity or resource. Any efficiency learned from one product can be applied to the other products. (This is related to the principle of least astonishment.)
For some examples, NASA quotes the following progress ratios in experience curves from different industries:[12]
Graphically, the curve is truncated. Existing processes become obsolete and the firm must upgrade to remain competitive. The upgrade will mean the old experience curve will be replaced by a new one. This occurs when:
Competitors introduce new products or processes that demand a response
Key suppliers have much bigger customers that determine the price of products and services, and that becomes the main cost driver for the product
Technological change requires a change in processes to remain competitive
The experience curve strategies must be re-evaluated because
they are not producing a marketing mix that the market values
Strategic consequences of the effect
Henderson wrote on the development of the experience curve.[4][13] According to Henderson, BCG's first "attempt to explain cost behavior over time in a process industry" began in 1966.[4] The datum he focused on was the striking correlation between competitive profitability and market share. Using price data in the semiconductor industry supplied by the Electronic Industries Association, he suggested that not one but two patterns emerged.[4]
"In one pattern, prices, in current dollars, remained constant for long periods and then began a relatively steep and long continued decline in constant dollars. In the other pattern, prices, in constant dollars, declined steadily at a constant rate of about 25 percent each time accumulated experience doubled. That was the experience curve."[4]
The suggestion was that failure of production to show the learning curve effect was a risk indicator. The BCG strategists examined the consequences of the experience effect for businesses. They concluded that because relatively low cost of operations is a very powerful strategic advantage, firms should invest in maximizing these learning and experience effects and that market share is underestimated as an enabler of this investment.[14] The reasoning is that increased activity leads to increased learning, which leads to lower costs, which can lead to lower prices, which can lead to increased market share, which can lead to increased profitability and market dominance. This was particularly true when a firm had an early leadership in market share. It was suggested that if a company cannot get enough market share to be competitive, it should exit that business and concentrate resources where it was possible to take advantage of experience effects and gain (preferably dominant) market share. The BCG strategists developed product portfolio techniques like the BCG Matrix (in part) to manage this strategy.
One consequence of experience curve strategy is that it predicts that cost savings should be passed on as price decreases rather than kept as profit margin increases. The BCG strategists felt that maintaining a relatively high price, although very profitable in the short run, spelled disaster for the strategy in the long run. High profits would encourage competitors to enter the market, triggering a steep price decline and a competitive shakeout. If prices were reduced as unit costs fell (due to experience curve effects), then competitive entry would be discouraged while market share increases should increase overall profitability.[citation needed]
Criticisms
Ernst R. Berndt claims that in most organizations, experience effects are so closely intertwined with economies of scale (efficiencies arising from an increased scale of production) that it is impossible to separate the two.[15] In practice, this view suggests, economies of scale coincide with experience effects (efficiencies arising from the learning and experience gained over repeated activities). The approach, however, accepts the existence of both as underlying causes. Economies of scale afford experience and experience may afford economies of scale.
Attempts to use the learning curve effect to improve competitive advantage, for instance by pre-emptively expanding production have been criticized, with factors such as bounded rationality and durable products cited as reasons for this.[16]
↑ Sterman, John D.; Henderson, Rebecca; Beinhocker, Eric D.; Newman, Lee I. (2007). "Getting Big Too Fast: Strategic Dynamics with Increasing Returns and Bounded Rationality". Management Science. 53 (4): 683–696. doi:10.1287/mnsc.1060.0673.
Junginger, Martin; van Sark, Wilfried; Faaij, André (2010), Technological Learning in the Energy Sector, Lessons for Policy, Industry and Science, Cheltenham: Edward Elgar Publishing, ISBN978-1-84844-834-6
This page is based on this Wikipedia article Text is available under the CC BY-SA 4.0 license; additional terms may apply. Images, videos and audio are available under their respective licenses.