
The troposphere is the lowest layer of the atmosphere of Earth. It contains 80% of the total mass of the planetary atmosphere and 99% of the total mass of water vapor and aerosols, and is where most weather phenomena occur. From the planetary surface of the Earth, the average height of the troposphere is 18 km in the tropics; 17 km in the middle latitudes; and 6 km in the high latitudes of the polar regions in winter; thus the average height of the troposphere is 13 km.

In meteorology, a cyclone is a large air mass that rotates around a strong center of low atmospheric pressure, counterclockwise in the Northern Hemisphere and clockwise in the Southern Hemisphere as viewed from above. Cyclones are characterized by inward-spiraling winds that rotate about a zone of low pressure. The largest low-pressure systems are polar vortices and extratropical cyclones of the largest scale. Warm-core cyclones such as tropical cyclones and subtropical cyclones also lie within the synoptic scale. Mesocyclones, tornadoes, and dust devils lie within the smaller mesoscale.
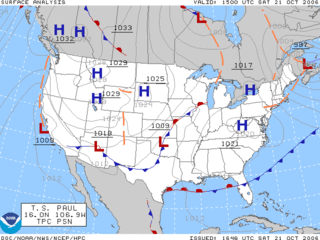
Surface weather analysis is a special type of weather map that provides a view of weather elements over a geographical area at a specified time based on information from ground-based weather stations.

A squall is a sudden, sharp increase in wind speed lasting minutes, as opposed to a wind gust, which lasts for only seconds. They are usually associated with active weather, such as rain showers, thunderstorms, or heavy snow. Squalls refer to the increase of the sustained winds over that time interval, as there may be higher gusts during a squall event. They usually occur in a region of strong sinking air or cooling in the mid-atmosphere. These force strong localized upward motions at the leading edge of the region of cooling, which then enhances local downward motions just in its wake.

In meteorology, an air mass is a volume of air defined by its temperature and humidity. Air masses cover many hundreds or thousands of square miles, and adapt to the characteristics of the surface below them. They are classified according to latitude and their continental or maritime source regions. Colder air masses are termed polar or arctic, while warmer air masses are deemed tropical. Continental and superior air masses are dry, while maritime and monsoon air masses are moist. Weather fronts separate air masses with different density characteristics. Once an air mass moves away from its source region, underlying vegetation and water bodies can quickly modify its character. Classification schemes tackle an air mass's characteristics, as well as modification.
A weather map, also known as synoptic weather chart, displays various meteorological features across a particular area at a particular point in time and has various symbols which all have specific meanings. Such maps have been in use since the mid-19th century and are used for research and weather forecasting purposes. Maps using isotherms show temperature gradients, which can help locate weather fronts. Isotach maps, analyzing lines of equal wind speed, on a constant pressure surface of 300 or 250 hPa show where the jet stream is located. Use of constant pressure charts at the 700 and 500 hPa level can indicate tropical cyclone motion. Two-dimensional streamlines based on wind speeds at various levels show areas of convergence and divergence in the wind field, which are helpful in determining the location of features within the wind pattern. A popular type of surface weather map is the surface weather analysis, which plots isobars to depict areas of high pressure and low pressure. Cloud codes are translated into symbols and plotted on these maps along with other meteorological data that are included in synoptic reports sent by professionally trained observers.

In meteorology, a low-pressure area, low area or low is a region where the atmospheric pressure is lower than that of surrounding locations. It is the opposite of a high-pressure area. Low-pressure areas are commonly associated with inclement weather, while high-pressure areas are associated with lighter winds and clear skies. Winds circle anti-clockwise around lows in the northern hemisphere, and clockwise in the southern hemisphere, due to opposing Coriolis forces. Low-pressure systems form under areas of wind divergence that occur in the upper levels of the atmosphere (aloft). The formation process of a low-pressure area is known as cyclogenesis. In meteorology, atmospheric divergence aloft occurs in two kinds of places:

In meteorology, the synoptic scale is a horizontal length scale of the order of 1,000 km (620 mi) or more. This corresponds to a horizontal scale typical of mid-latitude depressions. Most high- and low-pressure areas seen on weather maps are synoptic-scale systems, driven by the location of Rossby waves in their respective hemisphere. Low-pressure areas and their related frontal zones occur on the leading edge of a trough within the Rossby wave pattern, while high-pressure areas form on the back edge of the trough. Most precipitation areas occur near frontal zones. The word synoptic is derived from the Ancient Greek word συνοπτικός (sunoptikós), meaning "seen together".

In meteorology, a downburst is a strong downward and outward gushing wind system that emanates from a point source above and blows radially, that is, in straight lines in all directions from the area of impact at surface level. It originates under deep, moist convective conditions like cumulus congestus or cumulonimbus. Capable of producing damaging winds, it may sometimes be confused with a tornado, where high-velocity winds circle a central area, and air moves inward and upward. These usually last for seconds to minutes. Downbursts are particularly strong downdrafts within thunderstorms . Downbursts are most often created by an area of significantly precipitation-cooled air that, after reaching the surface (subsiding), spreads out in all directions producing strong winds.

Cyclogenesis is the development or strengthening of cyclonic circulation in the atmosphere. Cyclogenesis is an umbrella term for at least three different processes, all of which result in the development of some sort of cyclone, and at any size from the microscale to the synoptic scale.
A pressure system is a peak or lull in the sea level pressure distribution, a feature of synoptic-scale weather. The surface pressure at sea level varies minimally, with the lowest value measured 87 kilopascals (26 inHg) and the highest recorded 108.57 kilopascals (32.06 inHg). High- and low-pressure systems evolve due to interactions of temperature differentials in the atmosphere, temperature differences between the atmosphere and water within oceans and lakes, the influence of upper-level disturbances, as well as the amount of solar heating or radiationized cooling an area receives. Pressure systems cause weather to be experienced locally. Low-pressure systems are associated with clouds and precipitation that minimize temperature changes throughout the day, whereas high-pressure systems normally associate with dry weather and mostly clear skies with larger diurnal temperature changes due to greater radiation at night and greater sunshine during the day. Pressure systems are analyzed by those in the field of meteorology within surface weather maps.
This is a list of meteorology topics. The terms relate to meteorology, the interdisciplinary scientific study of the atmosphere that focuses on weather processes and forecasting.
The potential temperature of a parcel of fluid at pressure is the temperature that the parcel would attain if adiabatically brought to a standard reference pressure , usually 1,000 hPa (1,000 mb). The potential temperature is denoted and, for a gas well-approximated as ideal, is given by

A weather front is a boundary separating air masses for which several characteristics differ, such as air density, wind, temperature, and humidity. Disturbed and unstable weather due to these differences often arises along the boundary. For instance, cold fronts can bring bands of thunderstorms and cumulonimbus precipitation or be preceded by squall lines, while warm fronts are usually preceded by stratiform precipitation and fog. In summer, subtler humidity gradients known as dry lines can trigger severe weather. Some fronts produce no precipitation and little cloudiness, although there is invariably a wind shift.
In fluid mechanics, potential vorticity (PV) is a quantity which is proportional to the dot product of vorticity and stratification. This quantity, following a parcel of air or water, can only be changed by diabatic or frictional processes. It is a useful concept for understanding the generation of vorticity in cyclogenesis, especially along the polar front, and in analyzing flow in the ocean.

The following outline is provided as an overview of and topical guide to the field of Meteorology.
Atmospheric instability is a condition where the Earth's atmosphere is considered to be unstable and as a result local weather is highly variable through distance and time. Atmospheric instability encourages vertical motion, which is directly correlated to different types of weather systems and their severity. For example, under unstable conditions, a lifted parcel of air will find cooler and denser surrounding air, making the parcel prone to further ascent, in a positive feedback loop.
The following is a glossary of tornado terms. It includes scientific as well as selected informal terminology.
This glossary of meteorology is a list of terms and concepts relevant to meteorology and atmospheric science, their sub-disciplines, and related fields.

Conditional symmetric instability, or CSI, is a form of convective instability in a fluid subject to temperature differences in a uniform rotation frame of reference while it is thermally stable in the vertical and dynamically in the horizontal. The instability in this case develop only in an inclined plane with respect to the two axes mentioned and that is why it can give rise to a so-called "slantwise convection" if the air parcel is almost saturated and moved laterally and vertically in a CSI area. This concept is mainly used in meteorology to explain the mesoscale formation of intense precipitation bands in an otherwise stable region, such as in front of a warm front. The same phenomenon is also applicable to oceanography.
