Related Research Articles

Graph drawing is an area of mathematics and computer science combining methods from geometric graph theory and information visualization to derive two-dimensional depictions of graphs arising from applications such as social network analysis, cartography, linguistics, and bioinformatics.

Chartjunk consists of all visual elements in charts and graphs that are not necessary to comprehend the information represented on the graph, or that distract the viewer from this information.
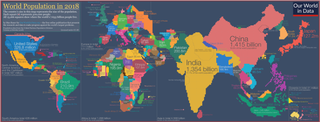
A cartogram is a thematic map of a set of features, in which their geographic size is altered to be directly proportional to a selected variable, such as travel time, population, or gross national income. Geographic space itself is thus warped, sometimes extremely, in order to visualize the distribution of the variable. It is one of the most abstract types of map; in fact, some forms may more properly be called diagrams. They are primarily used to display emphasis and for analysis as nomographs.
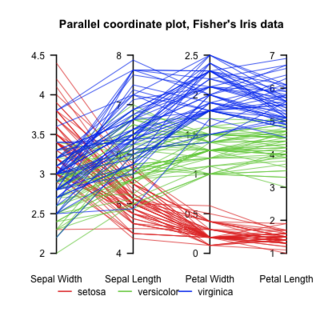
Parallel Coordinates plots are a common method of visualizing high-dimensional datasets to analyze multivariate data having multiple variables, or attributes.

In information visualization and computing, treemapping is a method for displaying hierarchical data using nested figures, usually rectangles.
The graph isomorphism problem is the computational problem of determining whether two finite graphs are isomorphic.
Software visualization or software visualisation refers to the visualization of information of and related to software systems—either the architecture of its source code or metrics of their runtime behavior—and their development process by means of static, interactive or animated 2-D or 3-D visual representations of their structure, execution, behavior, and evolution.

The International Symposium on Graph Drawing (GD) is an annual academic conference in which researchers present peer reviewed papers on graph drawing, information visualization of network information, geometric graph theory, and related topics.
Larry Joseph Stockmeyer was an American computer scientist. He was one of the pioneers in the field of computational complexity theory, and he also worked in the field of distributed computing. He died of pancreatic cancer.

In combinatorics and order theory, a multitree may describe either of two equivalent structures: a directed acyclic graph (DAG) in which there is at most one directed path between any two vertices, or equivalently in which the subgraph reachable from any vertex induces an undirected tree, or a partially ordered set (poset) that does not have four items a, b, c, and d forming a diamond suborder with a ≤ b ≤ d and a ≤ c ≤ d but with b and c incomparable to each other.

Christopher Ray Johnson is an American computer scientist. He is a distinguished professor of computer science at the University of Utah, and founding director of the Scientific Computing and Imaging Institute (SCI). His research interests are in the areas of scientific computing and scientific visualization.
The Journal of Graph Algorithms and Applications is a diamond open access peer-reviewed scientific journal covering the subject of graph algorithms and graph drawing. The journal was established in 1997 and the current co-editors-in-chief are Emilio Di Giacomo and Martin Nöllenburg. It is published by Brown University and is a member of the Free Journal Network. It is abstracted and indexed by Scopus and MathSciNet.
Space Gremlin is a disk space analysis tool for Mac OS X.

Tachyon is a parallel/multiprocessor ray tracing software. It is a parallel ray tracing library for use on distributed memory parallel computers, shared memory computers, and clusters of workstations. Tachyon implements rendering features such as ambient occlusion lighting, depth-of-field focal blur, shadows, reflections, and others. It was originally developed for the Intel iPSC/860 by John Stone for his M.S. thesis at University of Missouri-Rolla. Tachyon subsequently became a more functional and complete ray tracing engine, and it is now incorporated into a number of other open source software packages such as VMD, and SageMath. Tachyon is released under a permissive license.

Jean-Daniel Fekete is a French computer scientist.

An arc diagram is a style of graph drawing, in which the vertices of a graph are placed along a line in the Euclidean plane, with edges being drawn as semicircles in one or both of the two halfplanes bounded by the line, or as smooth curves formed by sequences of semicircles. In some cases, line segments of the line itself are also allowed as edges, as long as they connect only vertices that are consecutive along the line. Variations of this drawing style in which the semicircles are replaced by convex curves of some other type are also commonly called arc diagrams.
A software map represents static, dynamic, and evolutionary information of software systems and their software development processes by means of 2D or 3D map-oriented information visualization. It constitutes a fundamental concept and tool in software visualization, software analytics, and software diagnosis. Its primary applications include risk analysis for and monitoring of code quality, team activity, or software development progress and, generally, improving effectiveness of software engineering with respect to all related artifacts, processes, and stakeholders throughout the software engineering process and software maintenance.
The IEEE Visualization Conference (VIS) is an annual conference on scientific visualization, information visualization, and visual analytics administrated by the IEEE Computer Society Technical Committee on Visualization and Graphics. As ranked by Google Scholar's h-index metric in 2016, VIS is the highest rated venue for visualization research and the second-highest rated conference for computer graphics over all. It has an 'A' rating from the Australian Ranking of ICT Conferences, an 'A' rating from the Brazilian ministry of education, and an 'A' rating from the China Computer Federation (CCF). The conference is highly selective with generally < 25% acceptance rates for all papers.
Jessica Hullman is a computer scientist and the Ginni Rometty professor of Computer Science at Northwestern University. She is known for her research in Information visualization and Uncertainty quantification.
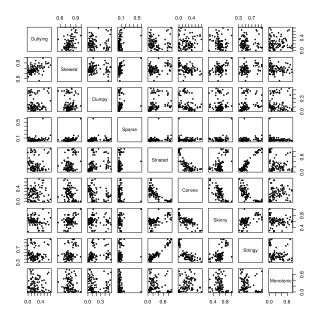
Scagnostics is a series of measures that characterize certain properties of a point cloud in a scatter plot. The term and idea was coined by John Tukey and Paul Tukey, though they didn't publish it; later it was elaborated by Wilkinson, Anand, and Grossman. The following nine dimensions are considered:
- For the outliers in the data:
- outlying
- For the density of data points:
- skewed
- clumpy
- sparse
- striated
- For the shape of the point cloud:
- convex
- skinny
- stringy
- For trends in the data:
- monotony
References
- ↑ Riegler aus Providence, Alexandra (November 1, 2011), "Die vielen Arten, das Abstrakte sichtbar zu machen", Der Standard (in German).
- 1 2 3 "The 2007 Visualization Technical Achievement Award: Jarke J. van Wijk", IEEE Visualization Conference and IEEE Information Visualization Conference Proceedings 2008, IEEE Transactions on Visualization and Computer Graphics, p. xxii, doi:10.1109/TVCG.2008.156 .
- ↑ Jarke J. van Wijk at the Mathematics Genealogy Project
- 1 2 MagnaView Management Archived 2011-10-22 at the Wayback Machine , retrieved 2011-11-10.
- ↑ van Wijk, Jarke J. (1991), "Spot noise texture synthesis for data visualization", Proc. 18th Conf. Computer Graphics and Interactive Techniques (SIGGRAPH '91), pp. 309–318, doi: 10.1145/122718.122751 , ISBN 978-0897914369
- ↑ Van Wijk, J.J.; Van de Wetering, H. (1999), "Cushion treemaps: visualization of hierarchical information", Proc. IEEE Symp. Information Visualization (Info Vis '99), pp. 73–78, CiteSeerX 10.1.1.41.9759 , doi:10.1109/INFVIS.1999.801860, ISBN 978-0-7695-0431-5, S2CID 195861945 .
- ↑ Bruls, Mark; Huizing, Kees; van Wijk, Jarke J. (2000), "Squarified treemaps", in de Leeuw, W.; van Liere, R. (eds.), Data Visualization 2000: Proc. Joint Eurographics and IEEE TCVG Symp. on Visualization (PDF), Springer-Verlag, pp. 33–42.
- ↑ de Leeuw, Willem C.; van Wijk, Jarke J. (1993), "A probe for local flow field visualization", Proc. 4th Conference on Visualization (VIS '93), pp. 39–45, doi:10.1109/VISUAL.1993.398849, ISBN 978-0-8186-3940-1, S2CID 30679206 .
- ↑ van Wijk, Jarke J. (2002), "Image based flow visualization", Proc. 29th Conf. Computer Graphics and Interactive Techniques (SIGGRAPH '02), pp. 745–754, CiteSeerX 10.1.1.134.5780 , doi:10.1145/566570.566646, ISBN 978-1581135213, S2CID 14771144 .
- ↑ Aron, Jacob (December 10, 2009), "Clever folds in a globe give new perspectives on Earth", New Scientist.
- ↑ MagnaView CSO awarded Henry Johns Award of British Cartographic Society, MagnaView, June 18, 2009, archived from the original on April 25, 2012, retrieved November 10, 2011.
- ↑ The Henry Johns Award 2009, The British Cartographic Society, retrieved 2011-11-10.
- ↑ van Ham, F.; Van Wijk, J.J. (2004), "Interactive Visualization of Small World Graphs", Proc. IEEE Symp. Information Visualization (INFOVIS 2004), pp. 199–206, doi:10.1109/INFVIS.2004.43, ISBN 978-0-7803-8779-9, S2CID 9982808 .
- ↑ Kleiberg, Ernst; van de Wetering, Huub; Wijk, Jarke J. Van (2001), "Botanical Visualization of Huge Hierarchies", IEEE Symp. Information Visualization (INFOVIS 2001), p. 87, CiteSeerX 10.1.1.332.1952 , doi:10.1109/INFVIS.2001.963285, ISBN 978-0-7695-7342-7, S2CID 9930408 .
- ↑ Holten, Danny; van Wijk, Jarke J. (2009), "A user study on visualizing directed edges in graphs", Proceedings of the 27th International Conference on Human Factors in Computing Systems (CHI '09) (PDF), pp. 2299–2308, CiteSeerX 10.1.1.212.5461 , doi:10.1145/1518701.1519054, ISBN 9781605582467, S2CID 9725345, archived from the original (PDF) on 2011-11-06.
- ↑ Holten, Danny; Isenberg, Petra; van Wijk, Jarke J.; Fekete, Jean-Daniel (2011), "An extended evaluation of the readability of tapered, animated, and textured directed-edge representations in node-link graphs", IEEE Pacific Visualization Symposium (PacificVis 2011) (PDF), pp. 195–202, doi:10.1109/PACIFICVIS.2011.5742390, ISBN 978-1-61284-935-5, S2CID 16526781 .
- ↑ Graph Drawing 2011 program, retrieved 2011-11-10.
- ↑ 2013 IEEE VIS Guest Speakers, retrieved 2014-11-18.