X-ray crystallography is the experimental science of determining the atomic and molecular structure of a crystal, in which the crystalline structure causes a beam of incident X-rays to diffract in specific directions. By measuring the angles and intensities of the X-ray diffraction, a crystallographer can produce a three-dimensional picture of the density of electrons within the crystal and the positions of the atoms, as well as their chemical bonds, crystallographic disorder, and other information.
The Protein Data Bank (PDB) is a database for the three-dimensional structural data of large biological molecules such as proteins and nucleic acids, which is overseen by the Worldwide Protein Data Bank (wwPDB). These structural data are obtained and deposited by biologists and biochemists worldwide through the use of experimental methodologies such as X-ray crystallography, NMR spectroscopy, and, increasingly, cryo-electron microscopy. All submitted data are reviewed by expert biocurators and, once approved, are made freely available on the Internet under the CC0 Public Domain Dedication. Global access to the data is provided by the websites of the wwPDB member organisations.

Structural bioinformatics is the branch of bioinformatics that is related to the analysis and prediction of the three-dimensional structure of biological macromolecules such as proteins, RNA, and DNA. It deals with generalizations about macromolecular 3D structures such as comparisons of overall folds and local motifs, principles of molecular folding, evolution, binding interactions, and structure/function relationships, working both from experimentally solved structures and from computational models. The term structural has the same meaning as in structural biology, and structural bioinformatics can be seen as a part of computational structural biology. The main objective of structural bioinformatics is the creation of new methods of analysing and manipulating biological macromolecular data in order to solve problems in biology and generate new knowledge.
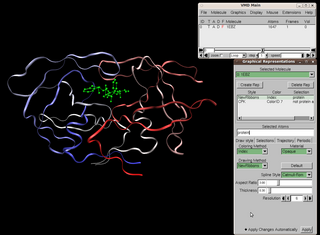
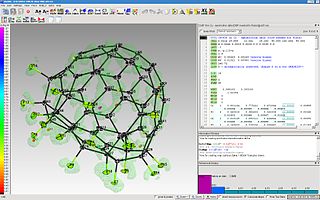
Visual Molecular Dynamics (VMD) is a molecular modelling and visualization computer program. VMD is developed mainly as a tool to view and analyze the results of molecular dynamics simulations. It also includes tools for working with volumetric data, sequence data, and arbitrary graphics objects. Molecular scenes can be exported to external rendering tools such as POV-Ray, RenderMan, Tachyon, Virtual Reality Modeling Language (VRML), and many others. Users can run their own Tcl and Python scripts within VMD as it includes embedded Tcl and Python interpreters. VMD runs on Unix, Apple Mac macOS, and Microsoft Windows. VMD is available to non-commercial users under a distribution-specific license which permits both use of the program and modification of its source code, at no charge.

In biochemistry, a Ramachandran plot, originally developed in 1963 by G. N. Ramachandran, C. Ramakrishnan, and V. Sasisekharan, is a way to visualize energetically allowed regions for backbone dihedral angles ψ against φ of amino acid residues in protein structure. The figure on the left illustrates the definition of the φ and ψ backbone dihedral angles. The ω angle at the peptide bond is normally 180°, since the partial-double-bond character keeps the peptide bond planar. The figure in the top right shows the allowed φ,ψ backbone conformational regions from the Ramachandran et al. 1963 and 1968 hard-sphere calculations: full radius in solid outline, reduced radius in dashed, and relaxed tau (N-Cα-C) angle in dotted lines. Because dihedral angle values are circular and 0° is the same as 360°, the edges of the Ramachandran plot "wrap" right-to-left and bottom-to-top. For instance, the small strip of allowed values along the lower-left edge of the plot are a continuation of the large, extended-chain region at upper left.
A chemical file format is a type of data file which is used specifically for depicting molecular data. One of the most widely used is the chemical table file format, which is similar to Structure Data Format (SDF) files. They are text files that represent multiple chemical structure records and associated data fields. The XYZ file format is a simple format that usually gives the number of atoms in the first line, a comment on the second, followed by a number of lines with atomic symbols and cartesian coordinates. The Protein Data Bank Format is commonly used for proteins but is also used for other types of molecules. There are many other types which are detailed below. Various software systems are available to convert from one format to another.
Nuclear magnetic resonance spectroscopy of proteins is a field of structural biology in which NMR spectroscopy is used to obtain information about the structure and dynamics of proteins, and also nucleic acids, and their complexes. The field was pioneered by Richard R. Ernst and Kurt Wüthrich at the ETH, and by Ad Bax, Marius Clore, Angela Gronenborn at the NIH, and Gerhard Wagner at Harvard University, among others. Structure determination by NMR spectroscopy usually consists of several phases, each using a separate set of highly specialized techniques. The sample is prepared, measurements are made, interpretive approaches are applied, and a structure is calculated and validated.
Molecular graphics is the discipline and philosophy of studying molecules and their properties through graphical representation. IUPAC limits the definition to representations on a "graphical display device". Ever since Dalton's atoms and Kekulé's benzene, there has been a rich history of hand-drawn atoms and molecules, and these representations have had an important influence on modern molecular graphics.

Jane Shelby Richardson is an American biophysicist best known for developing the Richardson diagram, or ribbon diagram, a method of representing the 3D structure of proteins. Ribbon diagrams have become a standard representation of protein structures that has facilitated further investigation of protein structure and function globally. With interests in astronomy, math, physics, botany, and philosophy, Richardson took an unconventional route to establishing a science career. Richardson is a professor in biochemistry at Duke University.
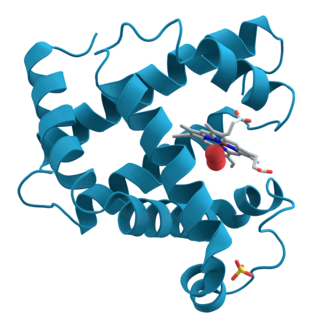
Ribbon diagrams, also known as Richardson diagrams, are 3D schematic representations of protein structure and are one of the most common methods of protein depiction used today. The ribbon depicts the general course and organisation of the protein backbone in 3D and serves as a visual framework for hanging details of the entire atomic structure, such as the balls for the oxygen atoms attached to myoglobin's active site in the adjacent figure. Ribbon diagrams are generated by interpolating a smooth curve through the polypeptide backbone. α-helices are shown as coiled ribbons or thick tubes, β-sheets as arrows, and non-repetitive coils or loops as lines or thin tubes. The direction of the polypeptide chain is shown locally by the arrows, and may be indicated overall by a colour ramp along the length of the ribbon.
WHAT IF is a computer program used in a wide variety of computational macromolecular structure research fields. The software provides a flexible environment to display, manipulate, and analyze small and large molecules, proteins, nucleic acids, and their interactions.
Resolution in the context of structural biology is the ability to distinguish the presence or absence of atoms or groups of atoms in a biomolecular structure. Usually, the structure originates from methods such as X-ray crystallography, electron crystallography, or cryo-electron microscopy. The resolution is measured of the "map" of the structure produced from experiment, where an atomic model would then be fit into. Due to their different natures and interactions with matter, in X-ray methods the map produced is of the electron density of the system, whereas in electron methods the map is of the electrostatic potential of the system. In both cases, atomic positions are assumed similarly.

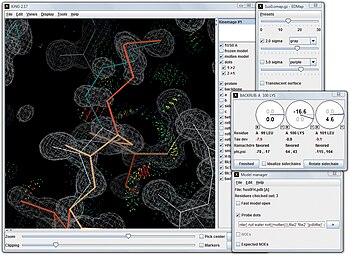
The program Coot is used to display and manipulate atomic models of macromolecules, typically of proteins or nucleic acids, using 3D computer graphics. It is primarily focused on building and validation of atomic models into three-dimensional electron density maps obtained by X-ray crystallography methods, although it has also been applied to data from electron microscopy.
The program ShelXle is a graphical user interface for the structure refinement program SHELXL. ShelXle combines an editor with syntax highlighting for the SHELXL-associated .ins (input) and .res (output) files with an interactive graphical display for visualization of a three-dimensional structure including the electron density (Fo) and difference density (Fo-Fc) maps.
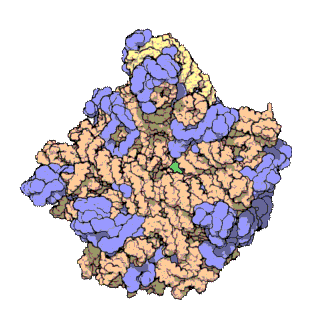
In molecular biology, the term macromolecular assembly (MA) refers to massive chemical structures such as viruses and non-biologic nanoparticles, cellular organelles and membranes and ribosomes, etc. that are complex mixtures of polypeptide, polynucleotide, polysaccharide or other polymeric macromolecules. They are generally of more than one of these types, and the mixtures are defined spatially, and with regard to their underlying chemical composition and structure. Macromolecules are found in living and nonliving things, and are composed of many hundreds or thousands of atoms held together by covalent bonds; they are often characterized by repeating units. Assemblies of these can likewise be biologic or non-biologic, though the MA term is more commonly applied in biology, and the term supramolecular assembly is more often applied in non-biologic contexts. MAs of macromolecules are held in their defined forms by non-covalent intermolecular interactions, and can be in either non-repeating structures, or in repeating linear, circular, spiral, or other patterns. The process by which MAs are formed has been termed molecular self-assembly, a term especially applied in non-biologic contexts. A wide variety of physical/biophysical, chemical/biochemical, and computational methods exist for the study of MA; given the scale of MAs, efforts to elaborate their composition and structure and discern mechanisms underlying their functions are at the forefront of modern structure science.

Macromolecular structure validation is the process of evaluating reliability for 3-dimensional atomic models of large biological molecules such as proteins and nucleic acids. These models, which provide 3D coordinates for each atom in the molecule, come from structural biology experiments such as x-ray crystallography or nuclear magnetic resonance (NMR). The validation has three aspects: 1) checking on the validity of the thousands to millions of measurements in the experiment; 2) checking how consistent the atomic model is with those experimental data; and 3) checking consistency of the model with known physical and chemical properties.
Resolution by Proxy (ResProx) is a method for assessing the equivalent X-ray resolution of NMR-derived protein structures. ResProx calculates resolution from coordinate data rather than from electron density or other experimental inputs. This makes it possible to calculate the resolution of a structure regardless of how it was solved. ResProx was originally designed to serve as a simple, single-number evaluation that allows straightforward comparison between the quality/resolution of X-ray structures and the quality of a given NMR structure. However, it can also be used to assess the reliability of an experimentally reported X-ray structure resolution, to evaluate protein structures solved by unconventional or hybrid means and to identify fraudulent structures deposited in the PDB. ResProx incorporates more than 25 different structural features to determine a single resolution-like value. ResProx values are reported in Angstroms. Tests on thousands of X-ray structures show that ResProx values match very closely to resolution values reported by X-ray crystallographers. Resolution-by-proxy values can be calculated for newly determined protein structures using a freely accessible ResProx web server. This server accepts protein coordinate data and generates a resolution estimate for that input structure.

Randy John Read is a Wellcome Trust Principal Research Fellow and professor of protein crystallography at the University of Cambridge.