
An alpha helix is a sequence of amino acids in a protein that are twisted into a coil.
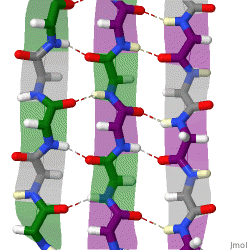
The beta sheet is a common motif of the regular protein secondary structure. Beta sheets consist of beta strands (β-strands) connected laterally by at least two or three backbone hydrogen bonds, forming a generally twisted, pleated sheet. A β-strand is a stretch of polypeptide chain typically 3 to 10 amino acids long with backbone in an extended conformation. The supramolecular association of β-sheets has been implicated in the formation of the fibrils and protein aggregates observed in amyloidosis, Alzheimer's disease and other proteinopathies.

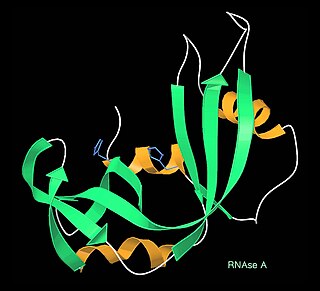
Protein secondary structure is the local spatial conformation of the polypeptide backbone excluding the side chains. The two most common secondary structural elements are alpha helices and beta sheets, though beta turns and omega loops occur as well. Secondary structure elements typically spontaneously form as an intermediate before the protein folds into its three dimensional tertiary structure.

Protein structure prediction is the inference of the three-dimensional structure of a protein from its amino acid sequence—that is, the prediction of its secondary and tertiary structure from primary structure. Structure prediction is different from the inverse problem of protein design.

Structural bioinformatics is the branch of bioinformatics that is related to the analysis and prediction of the three-dimensional structure of biological macromolecules such as proteins, RNA, and DNA. It deals with generalizations about macromolecular 3D structures such as comparisons of overall folds and local motifs, principles of molecular folding, evolution, binding interactions, and structure/function relationships, working both from experimentally solved structures and from computational models. The term structural has the same meaning as in structural biology, and structural bioinformatics can be seen as a part of computational structural biology. The main objective of structural bioinformatics is the creation of new methods of analysing and manipulating biological macromolecular data in order to solve problems in biology and generate new knowledge.
A kinemage is an interactive graphic scientific illustration. It often is used to visualize molecules, especially proteins although it can also represent other types of 3-dimensional data. The kinemage system is designed to optimize ease of use, interactive performance, and the perception and communication of detailed 3D information. The kinemage information is stored in a text file, human- and machine-readable, that describes the hierarchy of display objects and their properties, and includes optional explanatory text. The kinemage format is a defined chemical MIME type of 'chemical/x-kinemage' with the file extension '.kin'.
A coiled coil is a structural motif in proteins in which 2–7 alpha-helices are coiled together like the strands of a rope. They have been found in roughly 5-10% of proteins and have a variety of functions. They are one of the most widespread motifs found in protein-protein interactions. To aid protein study, several tools have been developed to predict coiled-coils in protein structures. Many coiled coil-type proteins are involved in important biological functions, such as the regulation of gene expression — e.g., transcription factors. Notable examples are the oncoproteins c-Fos and c-Jun, as well as the muscle protein tropomyosin.

In biochemistry, a Ramachandran plot, originally developed in 1963 by G. N. Ramachandran, C. Ramakrishnan, and V. Sasisekharan, is a way to visualize energetically allowed regions for backbone dihedral angles ψ against φ of amino acid residues in protein structure. The figure on the left illustrates the definition of the φ and ψ backbone dihedral angles. The ω angle at the peptide bond is normally 180°, since the partial-double-bond character keeps the peptide bond planar. The figure in the top right shows the allowed φ,ψ backbone conformational regions from the Ramachandran et al. 1963 and 1968 hard-sphere calculations: full radius in solid outline, reduced radius in dashed, and relaxed tau (N-Cα-C) angle in dotted lines. Because dihedral angle values are circular and 0° is the same as 360°, the edges of the Ramachandran plot "wrap" right-to-left and bottom-to-top. For instance, the small strip of allowed values along the lower-left edge of the plot are a continuation of the large, extended-chain region at upper left.

PyMOL is a source-available molecular visualization system created by Warren Lyford DeLano. It was commercialized initially by DeLano Scientific LLC, which was a private software company dedicated to creating useful tools that become universally accessible to scientific and educational communities. It is currently commercialized by Schrödinger, Inc. As the original software license was a permissive licence, they were able to remove it; new versions are no longer released under the Python license, but under a custom license, and some of the source code is no longer released. PyMOL can produce high-quality 3D images of small molecules and biological macromolecules, such as proteins. PyMOL is widely used.

Jmol is computer software for molecular modelling of chemical structures in 3 dimensions. It is an open-source Java viewer for chemical structures in 3D. The name originated from [J]ava + [mol]ecules, and also the mol file format.
Molecular graphics is the discipline and philosophy of studying molecules and their properties through graphical representation. IUPAC limits the definition to representations on a "graphical display device". Ever since Dalton's atoms and Kekulé's benzene, there has been a rich history of hand-drawn atoms and molecules, and these representations have had an important influence on modern molecular graphics.
A turn is an element of secondary structure in proteins where the polypeptide chain reverses its overall direction.

UCSF Chimera is an extensible program for interactive visualization and analysis of molecular structures and related data, including density maps, supramolecular assemblies, sequence alignments, docking results, trajectories, and conformational ensembles. High-quality images and movies can be created. Chimera includes complete documentation and can be downloaded free of charge for noncommercial use.
This list of structural comparison and alignment software is a compilation of software tools and web portals used in pairwise or multiple structural comparison and structural alignment.

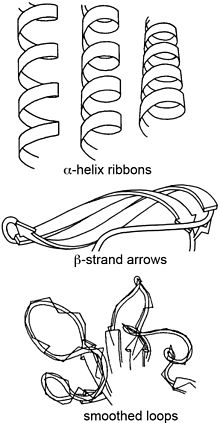
Jane Shelby Richardson is an American biophysicist best known for developing the Richardson diagram, or ribbon diagram, a method of representing the 3D structure of proteins. Ribbon diagrams have become a standard representation of protein structures that has facilitated further investigation of protein structure and function globally. With interests in astronomy, math, physics, botany, and philosophy, Richardson took an unconventional route to establishing a science career. Richardson is a professor in biochemistry at Duke University.

Arthur Mallay Lesk, is a protein science researcher, who is a professor of biochemistry and molecular biology at the Pennsylvania State University in University Park.
PDBsum is a database that provides an overview of the contents of each 3D macromolecular structure deposited in the Protein Data Bank (PDB).

The chemical shift index or CSI is a widely employed technique in protein nuclear magnetic resonance spectroscopy that can be used to display and identify the location as well as the type of protein secondary structure found in proteins using only backbone chemical shift data The technique was invented by David S. Wishart in 1992 for analyzing 1Hα chemical shifts and then later extended by him in 1994 to incorporate 13C backbone shifts. The original CSI method makes use of the fact that 1Hα chemical shifts of amino acid residues in helices tends to be shifted upfield relative to their random coil values and downfield in beta strands. Similar kinds of upfield and downfield trends are also detectable in backbone 13C chemical shifts.

In biochemistry, a backbone-dependent rotamer library provides the frequencies, mean dihedral angles, and standard deviations of the discrete conformations of the amino acid side chains in proteins as a function of the backbone dihedral angles φ and ψ of the Ramachandran map. By contrast, backbone-independent rotamer libraries express the frequencies and mean dihedral angles for all side chains in proteins, regardless of the backbone conformation of each residue type. Backbone-dependent rotamer libraries have been shown to have significant advantages over backbone-independent rotamer libraries, principally when used as an energy term, by speeding up search times of side-chain packing algorithms used in protein structure prediction and protein design.
