The economy of Iran is a mixed economy with a large state-owned sector and is one of the largest in the Middle East. It is the world's 21st largest by purchasing power parity (PPP). Some 60% of Iran's economy is centrally planned. It is dominated by oil and gas production, although over 40 industries are directly involved in the Tehran Stock Exchange. The stock exchange has been one of the best performing exchanges in the world over the past decade. With 10% of the world's proven oil reserves and 15% of its gas reserves, Iran is considered an "energy superpower".

Steel Authority of India Limited (SAIL) is a central public sector undertaking based in New Delhi, India. It is under the ownership of the Ministry of Steel, Government of India with an annual turnover of INR 1,03,480 Crore for fiscal year 2021–22. Incorporated on 24 January 1973, SAIL has 60,766 employees. With an annual production of 16.30 million metric tons, It is the largest government owned steel producer. The hot metal production capacity of the company will further increase and is expected to reach a level of 50 million tonnes per annum by 2025.

POSCO is a South Korean steel-making company headquartered in Pohang, South Korea. It had an output of 42,000,000 metric tons of crude steel in 2015, making it the world's sixth-largest steelmaker by this measure. In 2010, it was the world's largest steel manufacturing company by market value. Also, in 2012, it was named as the world's 146th-largest corporation by the Fortune Global 500.

The economy of India has transitioned from a mixed planned economy to a mixed middle-income developing social market economy with notable state participation in strategic sectors. It is the world's fifth-largest economy by nominal GDP and the third-largest by purchasing power parity (PPP). According to the International Monetary Fund (IMF), on a per capita income basis, India ranked 142nd by GDP (nominal) and 125th by GDP (PPP). From independence in 1947 until 1991, successive governments followed Soviet style planned economy and promoted protectionist economic policies, with extensive state intervention and economic regulation. This is characterised as dirigism, in the form of the License Raj. The end of the Cold War and an acute balance of payments crisis in 1991 led to the adoption of a broad economic liberalisation in India. Since the start of the 21st century, annual average GDP growth has been 6% to 7%. The economy of the Indian subcontinent was the largest in the world for most of recorded history up until the onset of colonialism in early 19th century. India accounted for 7.2% of global economy in 2022 in PPP terms, and around 3.4% in nominal terms in 2022.
Global strategic petroleum reserves (GSPR) refer to crude oil inventories held by the government of a particular country, as well as private industry, to safeguard the economy and help maintain national security during an energy crisis. Strategic reserves are intended to be used to cover short-term supply disruptions.

The National Petrochemical Company (NPC), a subsidiary to the Iranian Petroleum Ministry, is owned by the government of the Islamic Republic of Iran. It is responsible for the development and operation of the country's petrochemical sector. Founded in 1964, NPC began its activities by operating a small fertilizer plant in Shiraz. Today, NPC is the second largest producer and exporter of petrochemicals in the Middle East. Over these years, it has not only expanded the range and volume of its products, but it has also taken steps in areas such as R&D to achieve more self-sufficiency.
Iron ore production in Africa is dominated by South Africa, Mauritania and Algeria. Many countries possess iron ore deposits that are as yet untapped/unmined. Countries and companies currently involved in production are listed here; measurements are in tonnes per annum(year).

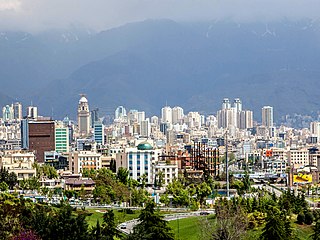
The construction industry of Iran is divided into two main sections. The first is government infrastructure projects, which are central for the cement industry. The second is the housing industry. In recent years, the construction industry has been thriving due to an increase in national and international investment to the extent that it is now the largest in the Middle East region. The Central Bank of Iran indicate that 70 percent of the Iranians own homes, with huge amounts of idle money entering the housing market. Iran has three shopping malls among the largest shopping malls in the world. Iran Mall is the largest shopping mall in the world, located in Tehran. The annual turnover in the construction industry amounts to US$38.4 billion. The real estate sector contributed to 5% of GDP in 2008. Statistics from March 2004 to March 2005 put the number of total Iranian households at 15.1 million and the total number of dwelling units at 13.5 million, signifying a demand for at least 5.1 million dwelling units. Every year there is a need for 750,000 additional units as young couples embark on married life. At present, 2000 units are being built every day although this needs to increase to 2740 units. Iran's construction market will expand to $154.4 billion in 2016 from $88.7 billion in 2013.

Mining in Iran is still under development, yet the country is one of the most important mineral producers in the world, ranked among 15 major mineral-rich countries, holding some 68 types of minerals, 37 billion tonnes of proven reserves and more than 57 billion tonnes of potential reserves worth $770 billion in 2014. Mineral production contributes only 0.6 per cent to the country's GDP. Add other mining-related industries and this figure increases to just four per cent (2005). Many factors have contributed to this, namely lack of suitable infrastructure, legal barriers, exploration difficulties, and government control.

Denmark has considerable sources of oil and natural gas in the North Sea and ranked as number 32 in the world among net exporters of crude oil in 2008. Denmark expects to be self-sufficient with oil until 2050. However, gas resources are expected to decline, and production may decline below consumption in 2020, making imports necessary. Denmark imports around 12% of its energy.

Ensuring adequate energy supply to sustain economic growth has been a core concern of the Chinese government since 1949. The country is the world's largest emitter of greenhouse gases, and coal in China is a major cause of global warming. However, from 2010 to 2015 China reduced energy consumption per unit of GDP by 18%, and CO2 emissions per unit of GDP by 20%. On a per-capita basis, it was the world's 51st largest emitter of greenhouse gases in 2016. China is also the world's largest renewable energy producer. China is the largest producer of hydroelectricity, solar power and wind power in the world. The energy policy of China is connected to its industrial policy. The goals of China's industrial policy dictate its energy needs.
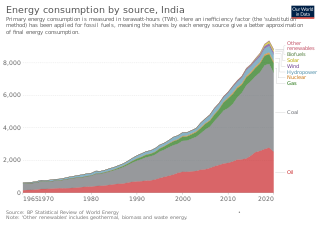
Since 2013, total primary energy consumption in India has been the third highest in the world after China and United States. India is the second-top coal consumer in the year 2017 after China. India ranks third in oil consumption with 22.1 crore tons in 2017 after United States and China. India is net energy importer to meet nearly 47% of its total primary energy in 2019.

The economy of Ohio nominally would be the 21st largest global economy behind Saudi Arabia and ahead of Argentina according to the 2017 International Monetary Fund GDP estimates. The state had a GDP of $656.19 billion in 3rd quarter of 2017, up from $517.1 billion in 2012, and up from $501.3 billion in 2011, according to the Bureau of Economic Analysis. In 2013, Ohio was ranked in the top ten states for best business climate by Site Selection magazine, based on a business-activity database. The state was edged out only by Texas and Nebraska for the 2013 Governor's Cup award from the magazine, based on business growth and economic development.

Energy in Belgium describes energy and electricity production, consumption and import in Belgium.

According to a report by The Economist, Iran has been ranked 39th for producing $23 billion of industrial products in 2008. From 2008 to 2009 Iran has leaped to 28th place from 69th place in annual industrial production growth rate.

The steel industry in China has been driven by rapid modernisation of its economy, construction, infrastructure and manufacturing industries.

Iran is an energy superpower and the petroleum industry in Iran plays an important part in it. In 2004, Iran produced 5.1 percent of the world's total crude oil, which generated revenues of US$25 billion to US$30 billion and was the country's primary source of foreign currency. At 2006 levels of production, oil proceeds represented about 18.7% of gross domestic product (GDP). However, the importance of the hydrocarbon sector to Iran's economy has been far greater. The oil and gas industry has been the engine of economic growth, directly affecting public development projects, the government's annual budget, and most foreign exchange sources.