The second Elections to Merseyside County Council were held on 5 May 1977. The Conservative party retained overall control of the council.
The Merseyside County Council (MCC) was, from 1974 to 1986, the upper-tier administrative body for Merseyside, a metropolitan county in North West England.
The Conservative Party, officially the Conservative and Unionist Party, is a centre-right political party in the United Kingdom. The governing party since 2010, it is the largest in the House of Commons, with 313 Members of Parliament, and also has 249 members of the House of Lords, 18 members of the European Parliament, 31 Members of the Scottish Parliament, 12 members of the Welsh Assembly, eight members of the London Assembly and 8,916 local councillors.
After the election, the composition of the council was:
Borough | Conservative | Labour | Liberal | Electorate | Turnout | |||||||||
---|---|---|---|---|---|---|---|---|---|---|---|---|---|---|
Seats | % Seats | Votes | % Votes | Seats | % Seats | Votes | % Votes | Seats | % Seats | Votes | % Votes | |||
Liverpool | 23 | 66% | 63,906 | 47% | 9 | 26% | 38,754 | 28% | 3 | 9% | 33,149 | 24% | 425,682 | 32% |
Knowsley | 4 | 36% | 18,095 | 48% | 7 | 64% | 16,747 | 45% | 0 | 0% | 1,272 | 3% | 127,690 | 29% |
St. Helens | 8 | 73% | 29,705 | 58% | 3 | 27% | 18,665 | 36% | 0 | 0% | 2,850 | 5.6% | 142,818 | 36% |
Sefton | 13 | 76% | 46,253 | 61% | 3 | 18% | 17,131 | 23% | 1 | 6% | 10,835 | 14% | 188,185 | 40% |
Wirral | 17 | 77% | 60,429 | 60% | 3 | 14% | 21,607 | 21% | 2 | 9% | 18,150 | 18% | 234,155 | 43% |
Merseyside | 65 | 68% | 218,388 | 54% | 25 | 26% | 112,904 | 28% | 6 | 6% | 66,256 | 17% | 1,118,430 | 36% |
* - Councillor seeking re-election
These election results are compared with the 1973 election results.
Party | Candidate | Votes | % | ± | |
---|---|---|---|---|---|
Labour | H. Carr | 1,401 | 57% | ||
Conservative | D. J. Lewis | 555 | 23% | ||
Communist | R. O'Hara | 253 | 10% | ||
Liberal | Mrs, P. A. Bradley | 144 | 6% | ||
Labour / Liberal | J. P. Murphy | 86 | 4% | ||
Majority | 846 | ||||
Registered electors | 13,507 | ||||
Turnout | 2,439 | 18% | |||
Labour hold | Swing | ||||
Party | Candidate | Votes | % | ± | |
---|---|---|---|---|---|
Conservative | S. T. Moss | 5,159 | 74% | ||
Liberal | P. J. Message | 1,116 | 16% | ||
Labour | J. Hughes | 727 | 10% | ||
Majority | 4,043 | ||||
Registered electors | 14,688 | ||||
Turnout | 7,002 | 48% | |||
Conservative gain from Liberal | Swing | ||||
Party | Candidate | Votes | % | ± | |
---|---|---|---|---|---|
Conservative | W. S. D. Weaver | 3,365 | 73% | ||
Liberal | T. H. Harte | 651 | 14% | ||
Labour | T. McManus | 592 | 13% | ||
Majority | 2,714 | ||||
Registered electors | 10,356 | ||||
Turnout | 4,608 | 44% | |||
Conservative hold | Swing | ||||
Party | Candidate | Votes | % | ± | |
---|---|---|---|---|---|
Conservative | T. P. Pink | 2,316 | 49% | ||
Labour | H. J. McGurk | 1,497 | 32% | ||
Liberal | J. Wilmington | 889 | 19% | ||
Majority | 819 | ||||
Registered electors | 13,161 | ||||
Turnout | 4,702 | 36% | |||
[[|N/A]] gain from [[|N/A]] | Swing | ||||
Party | Candidate | Votes | % | ± | |
---|---|---|---|---|---|
Conservative | H. A. Quayle | 1,872 | 43% | ||
Liberal | G. Scattergood | 1,457 | 33% | ||
Labour | F. S. Roderick | 885 | 20% | ||
Majority | 415 | ||||
Registered electors | 14,434 | ||||
Turnout | 4,385 | 30% | |||
[[|N/A]] gain from [[|N/A]] | Swing | ||||
Party | Candidate | Votes | % | ± | |
---|---|---|---|---|---|
Conservative | G. Butterfield | 1,346 | 41% | ||
Labour | G. G. Pratt | 1,023 | 31% | ||
Liberal | F. McNevin | 950 | 29% | ||
Majority | 323 | ||||
Registered electors | 11,443 | ||||
Turnout | 3,319 | 29% | |||
Labour gain from [[|N/A]] | Swing | ||||
Party | Candidate | Votes | % | ± | |
---|---|---|---|---|---|
Conservative | J. Keenan | 2,170 | 45% | ||
Liberal | R. Johnston | 1,864 | 39% | ||
Labour | C. H. J. Winter | 753 | 16% | ||
Majority | 306 | ||||
Registered electors | 12,362 | ||||
Turnout | 4,787 | 39% | |||
Conservative gain from [[|N/A]] | Swing | ||||
Party | Candidate | Votes | % | ± | |
---|---|---|---|---|---|
Labour | J. Parry | 1,518 | 62% | ||
W. P. Gerrard | 663 | 27% | |||
National Party of UK | M. Holme | 162 | 7% | ||
Liberal | J. A. Kelly | 120 | 5% | ||
Majority | 855 | ||||
Registered electors | 11,812 | ||||
Turnout | 2,463 | 21% | |||
Labour hold | Swing | ||||
Party | Candidate | Votes | % | ± | |
---|---|---|---|---|---|
Conservative | C. H. De Boer | 5,490 | 69% | ||
Conservative | Mrs. M. V. Wood | 5,202 | 65% | ||
Liberal | P. H. Hodgson | 1,333 | 17% | ||
Liberal | Mrs. F. C. Ricketts | 1,190 | 15% | ||
Labour | F. Dunne | 1,163 | 15% | ||
Labour | J. E. Roberts | 1,123 | 14% | ||
Majority | 4,157 | ||||
Registered electors | 19,102 | ||||
Turnout | 7,986 | 42% | |||
Conservative hold | Swing | ||||
Conservative win (new seat) | |||||
Party | Candidate | Votes | % | ± | |
---|---|---|---|---|---|
Conservative | H. C. Bolton-Jones | 3,607 | 51% | ||
Liberal | J. F. Bradley | 2,900 | 41% | ||
Labour | T. Roberts | 543 | 8% | ||
Majority | 707 | ||||
Registered electors | 14,436 | ||||
Turnout | 7,050 | 49% | |||
Conservative hold | Swing | ||||
Party | Candidate | Votes | % | ± | |
---|---|---|---|---|---|
Conservative | S. Hicklin | 1,512 | 39% | ||
Liberal | J. Bowen | 1,353 | 35% | ||
Labour | P. P. Rowlands | 1,028 | 26% | ||
Majority | 159 | ||||
Registered electors | 10,800 | ||||
Turnout | 3,893 | 36% | |||
Conservative gain from [[|N/A]] | Swing | ||||
Party | Candidate | Votes | % | ± | |
---|---|---|---|---|---|
Conservative | W. Thomas | 1,686 | 39% | ||
Liberal | P. R. Clark | 1,360 | 32% | ||
Labour | J. McLean | 1,223 | 29% | ||
Majority | 326 | ||||
Registered electors | 12,602 | ||||
Turnout | 4,269 | 34% | |||
Conservative gain from [[|N/A]] | Swing | ||||
Party | Candidate | Votes | % | ± | |
---|---|---|---|---|---|
Conservative | E. H. Fitzpatrick | 3,200 | 54% | ||
Liberal | G. L. Holmes | 1,923 | 33% | ||
Labour | J. Hudson | 773 | 13% | ||
Majority | 1,277 | ||||
Registered electors | 12,657 | ||||
Turnout | 5,896 | 47% | |||
Conservative gain from [[|N/A]] | Swing | ||||
Party | Candidate | Votes | % | ± | |
---|---|---|---|---|---|
Labour | Mrs. M. Evans | 980 | 54% | ||
Conservative | J. A. Watson | 591 | 33% | ||
Liberal | K. C. Osborne | 163 | 9% | ||
Communist | J. Greig | 76 | 4% | ||
Majority | 389 | ||||
Registered electors | 7,597 | ||||
Turnout | 1,810 | 24% | |||
Labour hold | Swing | ||||
Party | Candidate | Votes | % | ± | |
---|---|---|---|---|---|
Conservative | J. L. Walsh | 2,141 | 46% | ||
Labour | W. F. Burke | 1,919 | 41% | ||
Liberal | Miss Rosie Cooper | 591 | 13% | ||
Majority | 222 | ||||
Registered electors | 16,342 | ||||
Turnout | 4,651 | 28% | |||
Conservative gain from [[|N/A]] | Swing | ||||
Party | Candidate | Votes | % | ± | |
---|---|---|---|---|---|
Conservative | J. W. Davis | 1,219 | 38% | ||
Liberal | I. Bale | 1,091 | 28% | ||
Labour | S. J. Gorman | 831 | 26% | ||
National Front | Mrs. M. Dover | 49 | 2% | ||
Majority | 128 | ||||
Registered electors | 10,856 | ||||
Turnout | 3,190 | 29% | |||
Conservative gain from [[|N/A]] | Swing | ||||
Party | Candidate | Votes | % | ± | |
---|---|---|---|---|---|
Conservative | A. Brown | 1,219 | 50% | ||
Labour | A. Williams | 1,305 | 34% | ||
Liberal | N. T. Cardwell | 1,215 | 31% | ||
Majority | 723 | ||||
Registered electors | 11,774 | ||||
Turnout | 3,860 | 33% | |||
Conservative gain from [[|N/A]] | Swing | ||||
Party | Candidate | Votes | % | ± | |
---|---|---|---|---|---|
Labour | E. Roderick | 2,457 | 60% | ||
Conservative | Mrs. P. Dougherty | 1,658 | 40% | ||
Majority | 799 | ||||
Registered electors | 19,245 | ||||
Turnout | 4,115 | 21% | |||
Labour hold | Swing | ||||
Party | Candidate | Votes | % | ± | |
---|---|---|---|---|---|
Labour | Mrs. M. B. Simey | 1,545 | 47% | ||
Conservative | T. J. Staniford | 1,179 | 36% | ||
Liberal | A. E. Damsell | 376 | 11% | ||
Communist | Miss M. V. McLellabd | 175 | 5% | ||
Majority | 366 | ||||
Registered electors | 15,485 | ||||
Turnout | 3,275 | 21% | |||
Labour hold | Swing | ||||
Party | Candidate | Votes | % | ± | |
---|---|---|---|---|---|
Liberal | F. J. Doran | 1,340 | 58% | ||
Labour | J. H. Stamper | 510 | 22% | ||
Conservative | H. F. Davies | 450 | 20% | ||
Majority | 830 | ||||
Registered electors | 9,438 | ||||
Turnout | 2,300 | 24% | |||
Liberal gain from [[|N/A]] | Swing | ||||
Party | Candidate | Votes | % | ± | |
---|---|---|---|---|---|
Liberal | N. Caple | 1,507 | 55% | ||
Labour | J. A. Devaney | 892 | 32% | ||
Conservative | D. Jones | 350 | 13% | ||
National Front | S. J. Hamilton | ||||
Majority | 615 | ||||
Registered electors | 9,774 | ||||
Turnout | |||||
Liberal hold | Swing | ||||
Party | Candidate | Votes | % | ± | |
---|---|---|---|---|---|
Labour | B. Shaw | 1,184 | 59% | ||
Conservative | W. Gilbody | 632 | 32% | ||
Liberal | Mrs. R. McNally | 177 | 9% | ||
Majority | 552 | ||||
Registered electors | 11,283 | ||||
Turnout | 1,993 | 18% | |||
Labour hold | Swing | ||||
?
Party | Candidate | Votes | % | ± | |
---|---|---|---|---|---|
Conservative | W. V. Bradsshaw | 2,044 | 42% | ||
Liberal | Mrs. D. Jones | 1,780 | 37% | ||
Labour | D. E. Krumbein | 904 | 19% | ||
Communist | H. Mohin | 124 | 3% | ||
Independent Liberal | W. J. McCulloch | 83 | 2% | ||
Majority | 264 | ||||
Registered electors | 13,447 | ||||
Turnout | 4,852 | 36% | |||
Conservative hold | Swing | ||||
Party | Candidate | Votes | % | ± | |
---|---|---|---|---|---|
Liberal | P. Mahon | 1,973 | 43% | ||
Conservative | W. McGuirk | 1,285 | 28% | ||
Labour | R. N. Wareing | 1,223 | 27% | ||
Communist | J. G. Volleamere | 78 | 2% | ||
Majority | 688 | ||||
Registered electors | 12,225 | ||||
Turnout | 4,559 | ||||
Liberal gain from [[|N/A]] | Swing | ||||
Party | Candidate | Votes | % | ± | |
---|---|---|---|---|---|
Conservative | I. Brown | 2,393 | 47% | ||
Labour | H. Dalton | 2,302 | 45% | ||
Liberal | D. P. J. Turner | 413 | 8% | ||
Majority | 91 | ||||
Registered electors | 16,059 | ||||
Turnout | 5,108 | 32% | |||
Conservative gain from [[|N/A]] | Swing | ||||
Party | Candidate | Votes | % | ± | |
---|---|---|---|---|---|
Conservative | F. S. Hughes= | 1,403 | 46% | ||
Labour | G. J. Maudsley | 1,191 | 39% | ||
Liberal | C. J. Lister | 354 | 12% | ||
Communist | R. Ross | 94 | 3% | ||
Liberal . Un | S. J. Naden | 59 | 2% | ||
Majority | 212 | ||||
Registered electors | 10,105 | ||||
Turnout | 3,042 | 30% | |||
Conservative gain from [[|N/A]] | Swing | ||||
Party | Candidate | Votes | % | ± | |
---|---|---|---|---|---|
Conservative | R. S. Jones | 1,647 | 46% | ||
Liberal | Richard Kemp | 1,316 | 37% | ||
Labour | D. Ralston | 634 | 18% | ||
Majority | 331 | ||||
Registered electors | 10,693 | ||||
Turnout | 3,597 | 34% | |||
Conservative gain from [[|N/A]] | Swing | ||||
Party | Candidate | Votes | % | ± | |
---|---|---|---|---|---|
Labour | W. H. Sefton | 1,453 | 80% | ||
Conservative | K. B. Jacques | 238 | 13% | ||
Liberal | R. J. Cunningham | 128 | 7% | ||
Majority | 1,215 | ||||
Registered electors | 10,501 | ||||
Turnout | 1,819 | 17% | |||
Labour hold | Swing | ||||
Party | Candidate | Votes | % | ± | |
---|---|---|---|---|---|
Labour | Ken Stewart | 1,756 | 56% | ||
Conservative | C. W. Harpin | 1,164 | 37% | ||
Liberal | A. C. Pistotnick-Howard | 232 | 7% | ||
Majority | 592 | ||||
Registered electors | 14,808 | ||||
Turnout | 3,152 | 21% | |||
Labour hold | Swing | ||||
Party | Candidate | Votes | % | ± | |
---|---|---|---|---|---|
Conservative | D. P. Dougherty | 1,852 | 46% | ||
Liberal | R. Gore | 1,209 | 30% | ||
Labour | B. Simpson | 912 | 23% | ||
Communist | P. B. Bissette | 65 | 2% | ||
Majority | 643 | ||||
Registered electors | 11,678 | ||||
Turnout | 4,038 | 35% | |||
Conservative gain from [[|N/A]] | Swing | ||||
Party | Candidate | Votes | % | ± | |
---|---|---|---|---|---|
Conservative | R. B. Flude | 2,089 | 49% | ||
Liberal | I. C. Todd | 1,238 | 29% | ||
Labour | J. Finnegan | 898 | 21% | ||
Majority | 851 | ||||
Registered electors | 12,195 | ||||
Turnout | 4,225 | 35% | |||
Conservative gain from [[|N/A]] | Swing | ||||
Party | Candidate | Votes | % | ± | |
---|---|---|---|---|---|
Labour | L. Evans | 1,786 | 49% | ||
Conservative | J. H. Kirkham | 1,373 | 38% | ||
Liberal | Miss G. Loughney | 252 | 7% | ||
Communist | J. Humes | 211 | 6% | ||
Majority | 413 | ||||
Registered electors | 13,002 | ||||
Turnout | 3,622 | 28% | |||
Labour hold | Swing | ||||
Party | Candidate | Votes | % | ± | |
---|---|---|---|---|---|
Conservative | T. L. Hobday | 5,982 | 76% | ||
Conservative | L. B. Williams | 5,937 | 76% | ||
Labour | J. M. Lyon | 946 | 12% | ||
Liberal | Miss A. Smallman | 899 | 11% | ||
Labour | P. Owens | 874 | 11% | ||
Liberal | J. B. Kaltiff | 835 | 11% | ||
Majority | 5,036 | ||||
Registered electors | 17,820 | ||||
Turnout | 8,827 | 44% | |||
Conservative gain from Party (UK) | Swing | ||||
Conservative win (new seat) | |||||
Party | Candidate | Votes | % | ± | |
---|---|---|---|---|---|
Labour | P. Longfall | 1,126 | 60% | ||
Conservative | A. J. Gray | 762 | 40% | ||
Majority | 364 | ||||
Registered electors | 9,400 | ||||
Turnout | 1,888 | 20% | |||
Labour gain from {{{loser}}} | Swing | ||||
Party | Candidate | Votes | % | ± | |
---|---|---|---|---|---|
Conservative | J. E. Easthope | 1,562 | 55% | ||
Labour | C. D. Frederick | 1,288 | 45% | ||
Majority | 274 | ||||
Registered electors | 9,218 | ||||
Turnout | 2,850 | 31% | |||
Conservative gain from [[|N/A]] | Swing | ||||
Party | Candidate | Votes | % | ± | |
---|---|---|---|---|---|
Conservative | W. J. Simpson | 4,056 | 77% | ||
Labour | S. J. Wells | 1,209 | 23% | ||
Majority | 2,847 | ||||
Registered electors | 13,386 | ||||
Turnout | 5,265 | 39% | |||
Conservative gain from [[|N/A]] | Swing | ||||
Party | Candidate | Votes | % | ± | |
---|---|---|---|---|---|
Labour | S. S. Powell | 1,718 | 53% | ||
Conservative | C. W. White | 1,514 | 47% | ||
Majority | 204 | ||||
Registered electors | 11,377 | ||||
Turnout | 3,232 | 28% | |||
Conservative gain from [[|N/A]] | Swing | ||||
Party | Candidate | Votes | % | ± | |
---|---|---|---|---|---|
Labour | J. P. King | 1,450 | 56% | ||
Conservative | G. Fogarty | 627 | 24% | ||
Liberal | R. Jones | 349 | 14% | ||
Communist | J. Myers | 112 | 4.3% | ||
Independent Labour | T. B. Ryan | 45 | 2% | ||
Majority | 823 | ||||
Registered electors | 10,430 | ||||
Turnout | 2,583 | 25% | |||
Labour gain from [[|N/A]] | Swing | ||||
Party | Candidate | Votes | % | ± | |
---|---|---|---|---|---|
Labour | J. M. Gallagher | 1,431 | 46% | ||
Conservative | J. P. Smith | 1,088 | 35% | ||
Liberal | W. McFadden | 510 | 16% | ||
Communist | W. Jones | 116 | 3.7% | ||
Majority | 343 | ||||
Registered electors | 11,382 | ||||
Turnout | 3,145 | 28% | |||
Labour gain from [[|N/A]] | Swing | ||||
Party | Candidate | Votes | % | ± | |
---|---|---|---|---|---|
Labour | G. Bundred | 1,983 | 53% | ||
Conservative | C. R. Bailey | 1,187 | 31% | ||
Liberal | J. Smith | 413 | 11% | ||
Communist | T. Bradburn | 194 | 5.1% | ||
Majority | 796 | ||||
Registered electors | 15,609 | ||||
Turnout | 3,777 | 24% | |||
Labour gain from [[|N/A]] | Swing | ||||
Party | Candidate | Votes | % | ± | |
---|---|---|---|---|---|
Conservative | W. T. Hughes | 1,888 | 58% | ||
Labour | W. Howarth | 1,386 | 42% | ||
Majority | 502 | ||||
Registered electors | 8,759 | ||||
Turnout | 3,274 | 37% | |||
Conservative gain from {{{loser}}} | Swing | ||||
Party | Candidate | Votes | % | ± | |
---|---|---|---|---|---|
Labour | R. Foulkes | 1,444 | 40% | ||
Conservative | S. J. Pyne | 1,390 | 39% | ||
Conservative | B. Jeffrey | 765 | 21% | ||
Majority | 54 | ||||
Registered electors | 11,284 | ||||
Turnout | 3,599 | 32% | |||
Labour gain from [[|N/A]] | Swing | ||||
Party | Candidate | Votes | % | ± | |
---|---|---|---|---|---|
Conservative | J. Sinclair | 2,488 | 54% | ||
Labour | J. F. Bohanna | 2,094 | 46% | ||
Majority | 394 | ||||
Registered electors | 14,636 | ||||
Turnout | 4,582 | 31% | |||
Conservative gain from [[|N/A]] | Swing | ||||
Party | Candidate | Votes | % | ± | |
---|---|---|---|---|---|
Labour | W. Alldritt | 1,618 | 51% | ||
Conservative | T. D. Mawdsley | 1,533 | 49% | ||
Majority | 85 | ||||
Registered electors | 12,109 | ||||
Turnout | 3,151 | 26% | |||
Labour gain from [[|N/A]] | Swing | ||||
Party | Candidate | Votes | % | ± | |
---|---|---|---|---|---|
Conservative | P. Anderton | 2,969 | 55% | ||
Labour | C. Davies | 2,396 | 45% | ||
Majority | 573 | ||||
Registered electors | 11,022 | ||||
Turnout | 5,365 | 49% | |||
Conservative gain from [[|N/A]] | Swing | ||||
Party | Candidate | Votes | % | ± | |
---|---|---|---|---|---|
Labour | O. Conheeney | 2,920 | |||
Conservative | Miss M. Monks | 2,686 | 41% | ||
Liberal | R. Birch | 910 | 14% | ||
Majority | 234 | ||||
Registered electors | 16,022 | ||||
Turnout | 6,516 | 41% | |||
Labour gain from [[|N/A]] | Swing | ||||
Party | Candidate | Votes | % | ± | |
---|---|---|---|---|---|
Conservative | Mrs. A. Berry | 5,270 | 78% | ||
Labour | R. Cliff | 1,479 | 22% | ||
Majority | 3,971 | ||||
Registered electors | 14,053 | ||||
Turnout | 6,749 | 48% | |||
Conservative gain from [[|N/A]] | Swing | ||||
Party | Candidate | Votes | % | ± | |
---|---|---|---|---|---|
Conservative | Mrs. E. Jameson | 1,920 | 54% | ||
Labour | L. Williams | 1,380 | 39% | ||
Liberal | W. Iley | 260 | 7% | ||
Majority | 540 | ||||
Registered electors | 10,259 | ||||
Turnout | 3,560 | 35% | |||
Conservative gain from [[|N/A]] | Swing | ||||
Party | Candidate | Votes | % | ± | |
---|---|---|---|---|---|
Conservative | P. Harrison | 1,632 | 47% | ||
Labour | E. Maguire | 1,496 + | 43% | ||
Liberal | J. Bentham | 354 | 10% | ||
Majority | 136 | ||||
Registered electors | 11,760 | ||||
Turnout | 3,482 | 30% | |||
Conservative gain from [[|N/A]] | Swing | ||||
Party | Candidate | Votes | % | ± | |
---|---|---|---|---|---|
Labour | H. Glover | 2,062 | 44% | ||
Conservative | T. Webster | 1,713 | 37% | ||
Liberal | T. Gilligan | 863 | 19% | ||
Majority | 349 | ||||
Registered electors | 15,565 | ||||
Turnout | 4,638 | 30% | |||
Labour gain from [[|N/A]] | Swing | ||||
Party | Candidate | Votes | % | ± | |
---|---|---|---|---|---|
Conservative | E. Jameson | 3,364 | 63% | ||
Labour | N. Wilson | 1,770 | 33% | ||
Liberal | M. A. Kelly | 227 | 4% | ||
Majority | 1,594 | ||||
Registered electors | 13,452 | ||||
Turnout | 5,361 | 40% | |||
Conservative gain from [[|N/A]] | Swing | ||||
Party | Candidate | Votes | % | ± | |
---|---|---|---|---|---|
Conservative | E. Clough | 1,706 | 64% | ||
Labour | J. Morris | 953 | 36% | ||
Majority | 754 | ||||
Registered electors | 8,471 | ||||
Turnout | 2,659 | 31% | |||
Conservative gain from [[|N/A]] | Swing | ||||
Party | Candidate | Votes | % | ± | |
---|---|---|---|---|---|
Labour | F. Mernagh | 2,272 | 55% | ||
Conservative | C. Foster | 1,625 | 39% | ||
Liberal | I. Rigby | 236 | 6% | ||
Majority | 647 | ||||
Registered electors | 16,313 | ||||
Turnout | 25% | ||||
Labour gain from [[|N/A]] | Swing | ||||
Party | Candidate | Votes | % | ± | |
---|---|---|---|---|---|
Conservative | G. Brownlow | 3,954 | 88% | ||
Labour | B. Hamilton | 562 | 12% | ||
Majority | 3,392 | ||||
Registered electors | 9,404 | ||||
Turnout | 4,516 | 48% | |||
Conservative gain from [[|N/A]] | Swing | ||||
Party | Candidate | Votes | % | ± | |
---|---|---|---|---|---|
Conservative | Mrs. Nellie Holley | 2,866 | 68% | ||
Labour | E. Norris | 1,375 | 32% | ||
Majority | 1,491 | ||||
Registered electors | 16,497 | ||||
Turnout | 4,241 | 26% | |||
Conservative gain from [[|N/A]] | Swing | ||||
Party | Candidate | Votes | % | ± | |
---|---|---|---|---|---|
Conservative | F. P. Morris | 1,607 | 48% | ||
Labour | Hugh Baird | 1,450 | 43% | ||
Liberal | R. E. Williams | 243 | 7% | ||
Communist | T. Egan | 74 | 2% | ||
Majority | 157 | ||||
Registered electors | |||||
Turnout | 3,374 | ||||
Labour gain from [[|N/A]] | Swing | ||||
Party | Candidate | Votes | % | ± | |
---|---|---|---|---|---|
Labour | W. A. Wiseman | 1,121 | 59% | ||
Independent | G. Evason | 465 | 24% | ||
Conservative | T. I. Percy | 235 | 12% | ||
Communist | C. P. Curry | 94 | 5% | ||
Majority | 886 | ||||
Registered electors | 11,509 | ||||
Turnout | 1,915 | 17% | |||
Labour gain from [[|N/A]] | Swing | ||||
Party | Candidate | Votes | % | ± | |
---|---|---|---|---|---|
Labour | B. Hillen | 3,217 | 50% | ||
Labour | J. Riley | 3,126 | 48% | ||
Conservative | G. Halliwell | 2,981 | 46% | ||
Conservative | G. Lockley | 2,698 | 42% | ||
Communist | R. Morris | 263 | 4% | ||
Majority | 236 | ||||
Registered electors | 24,169 | ||||
Turnout | 6,461 | 27% | |||
Labour gain from [[|N/A]] | Swing | ||||
Labour win (new seat) | |||||
Party | Candidate | Votes | % | ± | |
---|---|---|---|---|---|
Conservative | N. C. Goldrein | 3,090 | 69% | ||
Labour | J. E. Ohren | 788 | 17% | ||
Liberal | G. A. Flaxman | 627 | 17% | ||
Majority | 2,302 | ||||
Registered electors | 12,423 | ||||
Turnout | 4,505 | 36% | |||
Conservative gain from [[|N/A]] | Swing | ||||
Party | Candidate | Votes | % | ± | |
---|---|---|---|---|---|
Conservative | R. O. Harvey | 1,995 | 56% | ||
Labour | J. M. Murphy | 1,356 | 38% | ||
Liberal | J. Sartain | 208 | 6% | ||
Majority | 639 | ||||
Registered electors | 10,731 | ||||
Turnout | 3,559 | 33% | |||
Conservative gain from [[|N/A]] | Swing | ||||
Party | Candidate | Votes | % | ± | |
---|---|---|---|---|---|
Conservative | W. R. Bennett | 2,585 | 72% | ||
Labour | D. F. Kerr | 706 | 20% | ||
Liberal | O. Adshead | 275 | 8% | ||
Majority | 1,879 | ||||
Registered electors | 9,676 | ||||
Turnout | 3,566 | 37% | |||
Conservative gain from [[|N/A]] | Swing | ||||
Party | Candidate | Votes | % | ± | |
---|---|---|---|---|---|
Conservative | F. L. Pritchard | 3,376 | 82% | ||
Liberal | S. M.. Sime | 454 | 11% | ||
Labour | G. Stringer | 300 | 7% | ||
Majority | 2,922 | ||||
Registered electors | 9,076 | ||||
Turnout | 4,130 | 46% | |||
Conservative gain from [[|N/A]] | Swing | ||||
Party | Candidate | Votes | % | ± | |
---|---|---|---|---|---|
Conservative | Sir K. P. Thompson | 5,758 | 81% | ||
Liberal | M. J. Metcalf | 1,376 | 19% | ||
Majority | 4,382 | ||||
Registered electors | 16,537 | ||||
Turnout | 7,134 | 43% | |||
Conservative gain from [[|N/A]] | Swing | ||||
Party | Candidate | Votes | % | ± | |
---|---|---|---|---|---|
Conservative | Mrs. G. Buckles | 2,653 | 48% | ||
Labour | O. F. Brady | 2,445 | 44% | ||
Liberal | K. Holding | 367 | 7% | ||
Communist | J. Hulligan | 81 | 1.5% | ||
Majority | 208 | ||||
Registered electors | 16,515 | ||||
Turnout | 5,546 | 34% | |||
Conservative gain from [[|N/A]] | Swing | ||||
Party | Candidate | Votes | % | ± | |
---|---|---|---|---|---|
Conservative | J. Hartley | 3,774 | 87% | ||
Labour | J. F. Caven | 436 | 10% | ||
Liberal | G. S. M. White | 961 | 26% | ||
Majority | 1,263 | ||||
Registered electors | 11,286 | ||||
Turnout | 3,740 | 33% | |||
Conservative gain from [[|N/A]] | Swing | ||||
Party | Candidate | Votes | % | ± | |
---|---|---|---|---|---|
Conservative | C. Rawstron | 2,224 | 59% | ||
Liberal | G. S. M. White | 961 | 26% | ||
Labour | W. P. Lafferty | 555 | 15% | ||
Majority | 1,263 | ||||
Registered electors | 11,286 | ||||
Turnout | 3.740 | 33% | |||
Conservative gain from [[|N/A]] | Swing | ||||
Party | Candidate | Votes | % | ± | |
---|---|---|---|---|---|
Conservative | J. S. Mitchell | 2,385 | 78% | ||
Liberal | E. E. Rothwell | 654 | 22% | ||
Majority | 1,731 | ||||
Registered electors | 9,023 | ||||
Turnout | 3,039 | 34% | |||
Conservative gain from [[|N/A]] | Swing | ||||
Party | Candidate | Votes | % | ± | |
---|---|---|---|---|---|
Liberal | R. C. Fearn | 2,438 | 50% | ||
Conservative | B. Dawson | 1,921 | 40% | ||
Labour | G. A. Fenerty | 476 | 10% | ||
Majority | 517 | ||||
Registered electors | 11,406 | ||||
Turnout | 4,835 | 42% | |||
Conservative gain from [[|N/A]] | Swing | ||||
Party | Candidate | Votes | % | ± | |
---|---|---|---|---|---|
Conservative | Mrs. J. Leech | 2,977 | 56% | ||
Liberal | P. J. Handley | 1,848 | 35% | ||
Labour | J. J. Abram | 474 | 9% | ||
Majority | 1,129 | ||||
Registered electors | 10,525 | ||||
Turnout | 5,299 | 50% | |||
Conservative gain from [[|N/A]] | Swing | ||||
Party | Candidate | Votes | % | ± | |
---|---|---|---|---|---|
Conservative | W. Brown | 2,712 | 67% | ||
Liberal | P. F. Reilly | 1,324 | 33% | ||
Majority | 1,388 | ||||
Registered electors | 10,436 | ||||
Turnout | 4,036 | 39% | |||
Conservative gain from [[|N/A]] | Swing | ||||
Party | Candidate | Votes | % | ± | |
---|---|---|---|---|---|
Conservative | A. I. Birch | 3,282 | 83% | ||
Labour | A. Riley | 681 | 17% | ||
Majority | 2,601 | ||||
Registered electors | 11,455 | ||||
Turnout | 3,963 | 35% | |||
Conservative gain from [[|N/A]] | Swing | ||||
Party | Candidate | Votes | % | ± | |
---|---|---|---|---|---|
Conservative | H. Harriman | 3,805 | 80% | ||
Liberal | Jean Walker | 970 | 20% | ||
Majority | 2,835 | ||||
Registered electors | 10,279 | ||||
Turnout | 4,775 | 46% | |||
Conservative gain from [[|N/A]] | Swing | ||||
Party | Candidate | Votes | % | ± | |
---|---|---|---|---|---|
Conservative | E. A. Davies | 2,138 | 51% | ||
Labour | B. A. Bryning | 1,709 | 41% | ||
Liberal | P. J. Taylor | 314 | 8% | ||
Majority | 429 | ||||
Registered electors | 9,776 | ||||
Turnout | 4,161 | 43% | |||
Conservative gain from [[|N/A]] | Swing | ||||
Party | Candidate | Votes | % | ± | |
---|---|---|---|---|---|
Liberal | P. N. Gilchrist | 2,816 | 45% | ||
Conservative | L. Chrishop | 2,256 | 36% | ||
Labour | A. E. S. Rose | 1,237 | 20% | ||
Majority | 560 | ||||
Registered electors | 12,857 | ||||
Turnout | 6,309 | 49% | |||
Liberal gain from [[|N/A]] | Swing | ||||
Party | Candidate | Votes | % | ± | |
---|---|---|---|---|---|
Conservative | F. J. K. Williams | 4,619 | 78% | ||
Liberal | T. Harbny | 1,321 | 22% | ||
Majority | 560 | ||||
Registered electors | 12,002 | ||||
Turnout | 5,940 | 49% | |||
Conservative gain from [[|N/A]] | Swing | ||||
Party | Candidate | Votes | % | ± | |
---|---|---|---|---|---|
Labour | J. Stuart-Cole | 1,290 | 50% | ||
Conservative | R. Entwistle | 716 | 28% | ||
Liberal | M. R. D. Gayford | 403 | 16% | ||
National Party (UK) | D. M. Matthews | 117 | 5% | ||
Young Communist League | J. E. Norris | 69 | 3% | ||
Majority | 574 | ||||
Registered electors | 8,985 | ||||
Turnout | 2,595 | 29% | |||
Labour gain from [[|N/A]] | Swing | ||||
Party | Candidate | Votes | % | ± | |
---|---|---|---|---|---|
Conservative | H. Welsh | 1,402 | 49% | ||
Labour | C. S. McRonald | 1,258 | 44% | ||
Liberal | T. J. Edwards | 190 | 7% | ||
Majority | 144 | ||||
Registered electors | 8,707 | ||||
Turnout | 2,850 | 33% | |||
Conservative gain from [[|N/A]] | Swing | ||||
Party | Candidate | Votes | % | ± | |
---|---|---|---|---|---|
Liberal | D. T. G. Evans | 1,826 | 55% | ||
Conservative | G. B. Porter | 1,395 | 42% | ||
Labour | W. W. Smith | 102 | 3% | ||
Majority | 431 | ||||
Registered electors | 9,993 | ||||
Turnout | 3,323 | 33% | |||
Liberal gain from [[|N/A]] | Swing | ||||
Party | Candidate | Votes | % | ± | |
---|---|---|---|---|---|
Conservative | W. R. Baker | 2,223 | 44% | ||
Liberal | D. W. Hughes | 1,600 | 32% | ||
Labour | G. Kenyon | 1,202 | 24% | ||
Majority | 624 | ||||
Registered electors | 12,461 | ||||
Turnout | 5,025 | 40% | |||
Conservative gain from [[|N/A]] | Swing | ||||
Party | Candidate | Votes | % | ± | |
---|---|---|---|---|---|
Labour | J. R. A. Flynn | 1,702 | 58% | ||
Conservative | R. A. Hodgkinson | 629 | 22% | ||
Liberal | E. Rose | 593 | 20% | ||
Majority | 1,073 | ||||
Registered electors | 9,030 | ||||
Turnout | 2,924 | 32% | |||
Labour gain from [[|N/A]] | Swing | ||||
Party | Candidate | Votes | % | ± | |
---|---|---|---|---|---|
Conservative | F. J. Moreton | 2,673 | 45% | ||
Liberal | G. C. Lindsay | 2,295 | 39% | ||
Labour | D. J. Healey | 833 | 14% | ||
National Party | W. R. Williams | 113 | 2% | ||
Majority | 378 | ||||
Registered electors | 12,348 | ||||
Turnout | 5,914 | 48% | |||
Conservative gain from [[|N/A]] | Swing | ||||
Party | Candidate | Votes | % | ± | |
---|---|---|---|---|---|
Conservative | A. E. Wise | 3,638 | 65% | ||
Labour | W. R. Leslie | 1,465 | 26% | ||
Liberal | E. J. Banton | 474 | 8% | ||
Majority | 2,173 | ||||
Registered electors | 15,882 | ||||
Turnout | 5,577 | 35% | |||
Conservative gain from [[|N/A]] | Swing | ||||
Party | Candidate | Votes | % | ± | |
---|---|---|---|---|---|
Conservative | Mrs. S. E. Hibbert | 3,990 | 61% | ||
Labour | E. C. Ainslie | 2,071 | 32% | ||
Liberal | A. B. Halliday | 470 | 7% | ||
Majority | 1,919 | ||||
Registered electors | 19,861 | ||||
Turnout | 6,531 | 33% | |||
Conservative gain from [[|N/A]] | Swing | ||||
Party | Candidate | Votes | % | ± | |
---|---|---|---|---|---|
Conservative | H. H. H. Needham | 4,471 | 82% | ||
Labour | J. Seaman | 500 | 9% | ||
Liberal | E. L. Fell | 495 | 5% | ||
Majority | 3,971 | ||||
Registered electors | 12,684 | ||||
Turnout | 5,466 | 43% | |||
Conservative gain from [[|N/A]] | Swing | ||||
Party | Candidate | Votes | % | ± | |
---|---|---|---|---|---|
Conservative | J. W. Last | 4,570 | 78% | ||
Liberal | I. Smith | 897 | 15% | ||
Labour | D. A. Jackson | 406 | 7% | ||
Majority | 3,673 | ||||
Registered electors | 11,992 | ||||
Turnout | 5,873 | 49% | |||
Conservative gain from [[|N/A]] | Swing | ||||
Party | Candidate | Votes | % | ± | |
---|---|---|---|---|---|
Conservative | K. R. Young | 1,943 | 47% | ||
Labour | B. Wells | 1,793 | 44% | ||
Liberal | G. J. Canning | 250 | 6% | ||
National Front | J. Fishwick | 133 | 3% | ||
Majority | 150 | ||||
Registered electors | 11,464 | ||||
Turnout | 4,119 | 36% | |||
Conservative gain from [[|N/A]] | Swing | ||||
Party | Candidate | Votes | % | ± | |
---|---|---|---|---|---|
Conservative | B. J. Frisby | 3,150 | 63% | ||
Labour | A. R. Chowderoy | 1,362 | 27% | ||
Liberal | N. R. L. Thomas | 523 | 10% | ||
Majority | 1,788 | ||||
Registered electors | |||||
Turnout | 5,035 | ||||
Conservative gain from [[|N/A]] | Swing | ||||
Party | Candidate | Votes | % | ± | |
---|---|---|---|---|---|
Conservative | I. W. Allison | 1,951 | 66% | ||
Labour | C. Allman | 873 | 29% | ||
Liberal | J. C. Jenkins | 154 | 5% | ||
Majority | 1,078 | ||||
Registered electors | 7,070 | ||||
Turnout | 2,978 | 42% | |||
Conservative gain from [[|N/A]] | Swing | ||||
Party | Candidate | Votes | % | ± | |
---|---|---|---|---|---|
Conservative | M. F. Emberton | 5,394 | 69% | ||
Liberal | Mrs. Kathleen Bowes | 2,036 | 26% | ||
Labour | Mrs. Beryl Lloyd | 335 | 4% | ||
Majority | 3,358 | ||||
Registered electors | 14,673 | ||||
Turnout | 7,765 | 53% | |||
Conservative gain from [[|N/A]] | Swing | ||||
Party | Candidate | Votes | % | ± | |
---|---|---|---|---|---|
Conservative | K. W. Porter | 3,362 | 76% | ||
Labour | M. D. Laskier | 647 | 15% | ||
Liberal | J. S. C. Timothy | 401 | 9% | ||
Majority | 2,715 | ||||
Registered electors | 11,774 | ||||
Turnout | 4,410 | 37% | |||
Conservative gain from [[|N/A]] | Swing | ||||
Party | Candidate | Votes | % | ± | |
---|---|---|---|---|---|
Labour | J. Gersham | 1,916 | 46% | ||
Conservative | Mrs. Marie Kemble | 1,829 | 44% | ||
Liberal | P. C. Mawdsley | 346 | 8% | ||
Communist | R. B. Harris | 93 | 2% | ||
Majority | 87 | ||||
Registered electors | 12,427 | ||||
Turnout | 4,184 | 34% | |||
Labour gain from [[|N/A]] | Swing | ||||
Party | Candidate | Votes | % | ± | |
---|---|---|---|---|---|
Conservative | J. C. Smyth | 4,840 | 88% | ||
Liberal | R. W. Thomas | 355 | 6% | ||
Labour | J. F. Durrant | 286 | 5% | ||
Majority | 4,485 | ||||
Registered electors | 11,022 | ||||
Turnout | 5,481 | 46% | |||
Conservative gain from [[|N/A]] | Swing | ||||
Party | Candidate | Votes | % | ± | |
---|---|---|---|---|---|
Conservative | F. K. Burlinson | 3,240 | 76% | ||
Labour | H. Ellis-Thomas | 620 | 15% | ||
Liberal | G. A. Collins | 391 | 9% | ||
Majority | 2,620 | ||||
Registered electors | 9,147 | ||||
Turnout | 4,251 | 46% | |||
Conservative gain from [[|N/A]] | Swing | ||||
The Metropolitan Borough of Wirral is a metropolitan borough of Merseyside, in North West England. It has a population of 321,238, and encompasses 60 square miles (160 km2) of the northern part of the Wirral Peninsula. Major settlements include Birkenhead, Wallasey, Bebington, Heswall, Hoylake and West Kirby. The city of Liverpool over the Mersey, faces the northeastern side of Wirral. Bordering is the River Mersey to the east, the Irish Sea to the north and the River Dee to the west; the borough of Cheshire West and Chester occupies the remainder of the Wirral Peninsula and borders the borough of Wirral to the south. The borough of Wirral has greater proportions of rural areas than the Liverpool part of Merseyside.
Liverpool City Council is the governing body for the city of Liverpool in Merseyside, England. It consists of 90 councillors, three for each of the city's 30 wards.
Liverpool City Council has existed since 1880, when Liverpool was awarded city status. Prior to this date the local authority was a town council.
The 1999 St Helens Metropolitan Borough Council election took place on 6 May 1999 to elect members of St Helens Metropolitan Borough Council in Merseyside, England. One third of the council was up for election and the Labour party stayed in overall control of the council.
The 2000 St Helens Metropolitan Borough Council election took place on 4 May 2000 to elect members of St Helens Metropolitan Borough Council in Merseyside, England. One third of the council was up for election and the Labour party stayed in overall control of the council.
The 2002 St Helens Metropolitan Borough Council election took place on 2 May 2002 to elect members of St Helens Metropolitan Borough Council in Merseyside, England. One third of the council was up for election and the Labour party stayed in overall control of the council.
The 2003 St Helens Metropolitan Borough Council election took place on 1 May 2003 to elect members of St Helens Metropolitan Borough Council in Merseyside, England. One third of the council was up for election and the Labour party stayed in overall control of the council.
The 2004 St Helens Metropolitan Borough Council election took place on 10 June 2004 to elect members of St Helens Metropolitan Borough Council in Merseyside, England. The whole council was up for election with boundary changes since the last election in 2003 reducing the number of seats by six. The Labour party lost overall control of the council to no overall control.
Sefton Council is the governing body for the Metropolitan Borough of Sefton in Merseyside, north-western England. The council was under no overall control from the 1980s until 2012 when the Labour Party took control. It is a constituent council of Liverpool City Region Combined Authority.
The 1998 Bolton Metropolitan Borough Council election took place on 7 May 1998 to elect members of Bolton Metropolitan Borough Council in Greater Manchester, England. One third of the council was up for election and the Labour party kept overall control of the council.
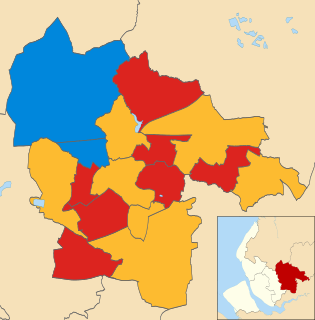
The 2006 St Helens Metropolitan Borough Council election took place on 4 May 2006 to elect members of St Helens Metropolitan Borough Council in Merseyside, England. One third of the council was up for election and the council stayed under no overall control.
The 2007 St Helens Metropolitan Borough Council election took place on 3 May 2007 to elect members of St Helens Metropolitan Borough Council in Merseyside, England. One third of the council was up for election and the council stayed under no overall control.
The 2002 Halton Borough Council election took place on 2 May 2002 to elect members of Halton Unitary Council in Cheshire, England. One third of the council was up for election and the Labour party stayed in overall control of the council.
Wirral Metropolitan Borough Council, or simply Wirral Council, is the local authority of the Metropolitan Borough of Wirral in Merseyside, England. It is a metropolitan district council, one of five in Merseyside and one of 36 in the metropolitan counties of England, and provides the majority of local government services in Wirral. It is a constituent council of Liverpool City Region Combined Authority.
The 2010 St Helens Metropolitan Borough Council election took place on 6 May 2010 to elect members of St Helens Metropolitan Borough Council in Merseyside, England. One third of the council was up for election and the Labour party gained overall control of the council from no overall control.
Elections to Mid Bedfordshire District Council were held in May 2007. These were the last elections to council, with all 53 seats being up for election. Councillors elected would serve a two-year term, expiring in 2009, when Mid Bedfordshire District Council was replaced by Central Bedfordshire Council. The Conservative Party retained overall control of the council, winning 37 of 53 seats on the council. The Conservatives won 8 seats unopposed, as did an Independent candidate in one ward.
Birkenhead and Tranmere is a Wirral Metropolitan Borough Council ward in the Birkenhead Parliamentary constituency.
The 1973 Merseyside County Council election took place on 12 April 1973 to elect members of Merseyside County Council in England. This was on the same day as other local elections.
The 1981 Merseyside County Council election took place on 7 May to elect members of Merseyside County Council in England. This was on the same day as other local elections.
The 1988 Wirral Metropolitan Borough Council election took place on 5 May 1988 to elect members of Wirral Metropolitan Borough Council in England. This election was held on the same day as other local elections.