Related Research Articles

A database is an organized collection of data, generally stored and accessed electronically from a computer system. Where databases are more complex they are often developed using formal design and modeling techniques.
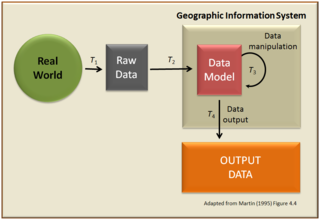
A geographic information system (GIS) is a conceptualized framework that provides the ability to capture and analyze spatial and geographic data. GIS applications are computer-based tools that allow the user to create interactive queries, store and edit spatial and non-spatial data, analyze spatial information output, and visually share the results of these operations by presenting them as maps.
The International Hydrographic Organization (IHO) is an intergovernmental organization representing hydrography. In October 2019 the IHO comprised 93 Member States.

A digital elevation model (DEM) is a 3D computer graphics representation of elevation data to represent terrain, commonly of a planet, moon, or asteroid. A "global DEM" refers to a discrete global grid. DEMs are used often in geographic information systems, and are the most common basis for digitally produced relief maps.

Hydrography is the branch of applied sciences which deals with the measurement and description of the physical features of oceans, seas, coastal areas, lakes and rivers, as well as with the prediction of their change over time, for the primary purpose of safety of navigation and in support of all other marine activities, including economic development, security and defense, scientific research, and environmental protection.

Hydrographic survey is the science of measurement and description of features which affect maritime navigation, marine construction, dredging, offshore oil exploration/offshore oil drilling and related activities. Strong emphasis is placed on soundings, shorelines, tides, currents, seabed and submerged obstructions that relate to the previously mentioned activities. The term hydrography is used synonymously to describe maritime cartography, which in the final stages of the hydrographic process uses the raw data collected through hydrographic survey into information usable by the end user.
Software development is the process of conceiving, specifying, designing, programming, documenting, testing, and bug fixing involved in creating and maintaining applications, frameworks, or other software components. Software development is a process of writing and maintaining the source code, but in a broader sense, it includes all that is involved between the conception of the desired software through to the final manifestation of the software, sometimes in a planned and structured process. Therefore, software development may include research, new development, prototyping, modification, reuse, re-engineering, maintenance, or any other activities that result in software products.

A bathymetric chart is a type of isarithmic map that depicts the submerged topography and physiographic features of ocean and sea bottoms. Their primary purpose is to provide detailed depth contours of ocean topography as well as provide the size, shape and distribution of underwater features. Topographic maps display elevation above ground and are complementary to bathymetric charts. Charts use a series of lines and points at equal intervals to showcase depth or elevation. A closed shape with increasingly smaller shapes inside of it can indicate an ocean trench or a seamount, or underwater mountain, depending on whether the depths increase or decrease going inward.

The Canadian Hydrographic Service (CHS) is part of the federal department of Fisheries and Oceans Canada and is Canada's authoritative hydrographic office. The CHS represents Canada in the International Hydrographic Organization (IHO).
Bathymetry is the study of underwater depth of ocean floors or lake floors. In other words, bathymetry is the underwater equivalent to hypsometry or topography. The name comes from Greek βαθύς (bathus), "deep", and μέτρον (metron), "measure". Bathymetric charts are typically produced to support safety of surface or sub-surface navigation, and usually show seafloor relief or terrain as contour lines and selected depths (soundings), and typically also provide surface navigational information. Bathymetric maps may also use a Digital Terrain Model and artificial illumination techniques to illustrate the depths being portrayed. The global bathymetry is sometimes combined with topography data to yield a Global Relief Model. Paleobathymetry is the study of past underwater depths.
GRIB is a concise data format commonly used in meteorology to store historical and forecast weather data. It is standardized by the World Meteorological Organization's Commission for Basic Systems, known under number GRIB FM 92-IX, described in WMO Manual on Codes No.306. Currently there are three versions of GRIB. Version 0 was used to a limited extent by projects such as TOGA, and is no longer in operational use. The first edition is used operationally worldwide by most meteorological centers, for Numerical Weather Prediction output (NWP). A newer generation has been introduced, known as GRIB second edition, and data is slowly changing over to this format. Some of the second-generation GRIB are used for derived product distributed in Eumetcast of Meteosat Second Generation. Another example is the NAM model.

A 3D city model is digital model of urban areas that represent terrain surfaces, sites, buildings, vegetation, infrastructure and landscape elements in three-dimensional scale as well as related objects belonging to urban areas. Their components are described and represented by corresponding two-dimensional and three-dimensional spatial data and geo-referenced data. 3D city models support presentation, exploration, analysis, and management tasks in a large number of different application domains. In particular, 3D city models allow "for visually integrating heterogeneous geoinformation within a single framework and, therefore, create and manage complex urban information spaces."
The General Bathymetric Chart of the Oceans (GEBCO) is a publicly available bathymetric chart of the world's oceans. The project was conceived with the aim of preparing a global series of charts showing the general shape of the seafloor. Over the years it has become a reference map of the bathymetry of the world’s oceans for scientists and others.
OpenSeaMap is a software project collecting freely usable nautical information and geospatial data to create a worldwide nautical chart. This chart is available on the OpenSeaMap website, and can also be downloaded for use as an electronic chart for offline applications.
Teledyne CARIS Inc. is a business unit of Teledyne Technologies and is a Canadian software company that develops and supports geomatics software for marine and land applications. The company is headquartered in Fredericton, New Brunswick, Canada. CARIS also has offices in the Netherlands, the United States and Australia, and has re-sellers offering sales and support of software products to more than 75 countries.

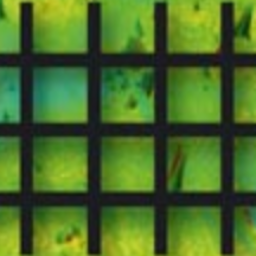
A Discrete Global Grid (DGG) is a mosaic which covers the entire Earth's surface. Mathematically it is a space partitioning: it consists of a set of non-empty regions that form a partition of the Earth's surface. In a usual grid-modeling strategy, to simplify position calculations, each region is represented by a point, abstracting the grid as a set of region-points. Each region or region-point in the grid is called a cell.
The National Centers for Environmental Information (NCEI), an agency of the United States government, manages one of the world's largest archives of atmospheric, coastal, geophysical, and oceanic data, containing information that ranges from the surface of the sun to Earth's core, and from ancient tree ring and ice core records to near-real-time satellite images.
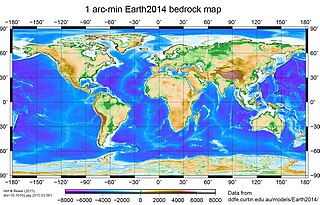
A global relief model, sometimes also denoted as global topography model or composite model, combines digital elevation model (DEM) data over land with digital bathymetry model (DBM) data over water-covered areas to describe Earth's relief. A relief model thus shows how Earth's surface would look like in the absence of water or ice masses.

Seafloor mapping, also called seabed imaging, is the measurement of water depth of a given body of water. Bathymetric measurements are conducted with various methods, from sonar and Lidar techniques to buoys and satellite altimetry. Various methods have advantages and disadvantages and the specific method used depends upon the scale of the area under study, financial means, desired measurement accuracy, and additional variables. Despite modern computer-based research, the ocean seabed in many locations is less measured than the topography of Mars.
Bathymetric Attributed Grid (BAG) is a file format designed to store and exchange bathymetric data.
References
- 1 2 Smith, Shepard (2003). The Navigation Surface: A Multipurpose Bathymetric Database (Masters). Durham, NH: University of New Hampshire . Retrieved 16 June 2018.
- 1 2 Titley, David (26 June 2009). "Implementation of Navigation Surface". Hydro International. Retrieved 17 June 2018.
- ↑ "The Open Navigation Surface project" . Retrieved 16 June 2018.
| This oceanography article is a stub. You can help Wikipedia by expanding it. |
| This standards- or measurement-related article is a stub. You can help Wikipedia by expanding it. |