Related Research Articles

In probability and statistics, Student's t-distribution is any member of a family of continuous probability distributions that arises when estimating the mean of a normally distributed population in situations where the sample size is small and the population standard deviation is unknown. It was developed by William Sealy Gosset under the pseudonym Student.

In probability theory and statistics, the chi-square distribution with k degrees of freedom is the distribution of a sum of the squares of k independent standard normal random variables. The chi-square distribution is a special case of the gamma distribution and is one of the most widely used probability distributions in inferential statistics, notably in hypothesis testing and in construction of confidence intervals. This distribution is sometimes called the central chi-square distribution, a special case of the more general noncentral chi-square distribution.
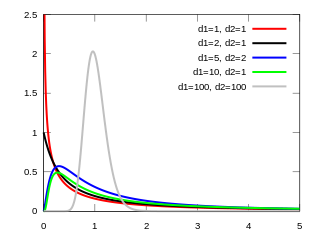
In probability theory and statistics, the F-distribution, also known as Snedecor's F distribution or the Fisher–Snedecor distribution is a continuous probability distribution that arises frequently as the null distribution of a test statistic, most notably in the analysis of variance (ANOVA), e.g., F-test.

A Z-test is any statistical test for which the distribution of the test statistic under the null hypothesis can be approximated by a normal distribution. Z-test tests the mean of a distribution. For each significance level in the confidence interval, the Z-test has a single critical value which makes it more convenient than the Student's t-test whose critical values are defined by the sample size.
The t-test is any statistical hypothesis test in which the test statistic follows a Student's t-distribution under the null hypothesis.
In null hypothesis significance testing, the p-value is the probability of obtaining test results at least as extreme as the results actually observed, under the assumption that the null hypothesis is correct. A very small p-value means that such an extreme observed outcome would be very unlikely under the null hypothesis. Reporting p-values of statistical tests is common practice in academic publications of many quantitative fields. Since the precise meaning of p-value is hard to grasp, misuse is widespread and has been a major topic in metascience.

In statistics, the generalized linear model (GLM) is a flexible generalization of ordinary linear regression that allows for response variables that have error distribution models other than a normal distribution. The GLM generalizes linear regression by allowing the linear model to be related to the response variable via a link function and by allowing the magnitude of the variance of each measurement to be a function of its predicted value.

In statistical significance testing, a one-tailed test and a two-tailed test are alternative ways of computing the statistical significance of a parameter inferred from a data set, in terms of a test statistic. A two-tailed test is appropriate if the estimated value is greater or less than a certain range of values, for example, whether a test taker may score above or below a specific range of scores. This method is used for null hypothesis testing and if the estimated value exists in the critical areas, the alternative hypothesis is accepted over the null hypothesis. A one-tailed test is appropriate if the estimated value may depart from the reference value in only one direction, left or right, but not both. An example can be whether a machine produces more than one-percent defective products. In this situation, if the estimated value exists in one of the one-sided critical areas, depending on the direction of interest, the alternative hypothesis is accepted over the null hypothesis. Alternative names are one-sided and two-sided tests; the terminology "tail" is used because the extreme portions of distributions, where observations lead to rejection of the null hypothesis, are small and often "tail off" toward zero as in the normal distribution, colored in yellow, or "bell curve", pictured on the right and colored in green.
In probability theory and statistics, the noncentral F-distribution is a continuous probability distribution that is a noncentral generalization of the (ordinary) F-distribution. It describes the distribution of the quotient (X/n1)/(Y/n2), where the numerator X has a noncentral chi-squared distribution with n1 degrees of freedom and the denominator Y has a central chi-squared distribution with n2 degrees of freedom. It is also required that X and Y are statistically independent of each other.
A test statistic is a statistic used in statistical hypothesis testing. A hypothesis test is typically specified in terms of a test statistic, considered as a numerical summary of a data-set that reduces the data to one value that can be used to perform the hypothesis test. In general, a test statistic is selected or defined in such a way as to quantify, within observed data, behaviours that would distinguish the null from the alternative hypothesis, where such an alternative is prescribed, or that would characterize the null hypothesis if there is no explicitly stated alternative hypothesis.
The following is a glossary of terms used in the mathematical sciences statistics and probability.
Weighted least squares (WLS), also known as weighted linear regression, is a generalization of ordinary least squares and linear regression in which the errors covariance matrix is allowed to be different from an identity matrix. WLS is also a specialization of generalized least squares in which the above matrix is diagonal.

In probability theory and statistics, the noncentral chi-square distribution is a noncentral generalization of the chi-square distribution. It often arises in the power analysis of statistical tests in which the null distribution is a chi-square distribution; important examples of such tests are the likelihood-ratio tests.
The noncentral t-distribution generalizes Student's t-distribution using a noncentrality parameter. Whereas the central probability distribution describes how a test statistic t is distributed when the difference tested is null, the noncentral distribution describes how t is distributed when the null is false. This leads to its use in statistics, especially calculating statistical power. The noncentral t-distribution is also known as the singly noncentral t-distribution, and in addition to its primary use in statistical inference, is also used in robust modeling for data.
Omnibus tests are a kind of statistical test. They test whether the explained variance in a set of data is significantly greater than the unexplained variance, overall. One example is the F-test in the analysis of variance. There can be legitimate significant effects within a model even if the omnibus test is not significant. For instance, in a model with two independent variables, if only one variable exerts a significant effect on the dependent variable and the other does not, then the omnibus test may be non-significant. This fact does not affect the conclusions that may be drawn from the one significant variable. In order to test effects within an omnibus test, researchers often use contrasts.
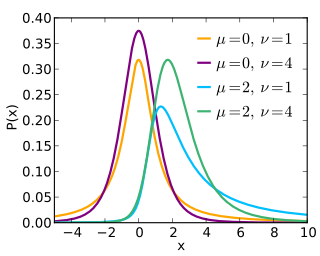
The generalized normal distribution or generalized Gaussian distribution (GGD) is either of two families of parametric continuous probability distributions on the real line. Both families add a shape parameter to the normal distribution. To distinguish the two families, they are referred to below as "version 1" and "version 2". However this is not a standard nomenclature.

In probability theory and statistics, the generalized chi-squared distribution is the distribution of a linear sum of independent noncentral chi-square variables and a normal variable, or equivalently, the distribution of a quadratic form of a multivariate normal distribution. There are several other such generalizations for which the same term is sometimes used; some of them are special cases of the family discussed here, for example the gamma distribution.
In probability and statistics, a compound probability distribution is the probability distribution that results from assuming that a random variable is distributed according to some parametrized distribution, with the parameters of that distribution themselves being random variables. If the parameter is a scale parameter, the resulting mixture is also called a scale mixture.
References
- ↑ Dodge, Y. (2003). The Oxford Dictionary of Statistical Terms, Oxford University Press. ISBN 0-19-920613-9
- ↑ Johnson, N.L., Kotz, S., Balakrishnan N. (1995). Continuous univariate distributions, Volume 2 (2nd Edition). Wiley. ISBN 0-471-58494-0