North Carolina's 34th State House of Representatives district | |||
---|---|---|---|
![]() | |||
Representative |
| ||
Demographics | 76% White 9% Black 9% Hispanic 3% Asian 3% Multiracial | ||
Population (2020) | 84,185 |
North Carolina's 34th House district is one of 120 districts in the North Carolina House of Representatives. It has been represented by Democrat Tim Longest since 2023. [1] [2]
Since 2003, the district has included part of Wake County. The district overlaps with the 15th, 16th, and 18th Senate districts.
Representative | Party | Dates | Notes | Counties |
---|---|---|---|---|
Bobby Griffin ( Monroe ) | Democratic | January 1, 1993 – January 1, 1995 | Lost re-election. | 1993–2003 Part of Union County. [3] |
![]() Fern Shubert ( Marshville ) | Republican | January 1, 1995 – January 1, 1999 | Lost re-election. | |
O. Max Melton ( Monroe ) | Democratic | January 1, 1999 – January 1, 2001 | Lost re-election. | |
![]() Fern Shubert ( Marshville ) | Republican | January 1, 2001 – January 1, 2003 | Redistricted to the 73rd district and retired to run for State Senate. | |
Don Munford ( Raleigh ) | Republican | January 1, 2003 – January 1, 2005 | Lost re-election. | 2003–Present Part of Wake County. [4] [5] [6] [7] [8] [9] [10] |
![]() Grier Martin ( Raleigh ) | Democratic | January 1, 2005 – January 1, 2013 | Retired. | |
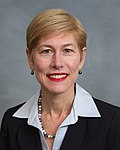
![]() Deborah Ross ( Raleigh ) | Democratic | January 1, 2013 – June 1, 2013 | Redistricted from the 38th district. Resigned. | |
![]() Grier Martin ( Raleigh ) | Democratic | June 1, 2013 – July 8, 2022 | Appointed to finish Ross's term. Resigned. | |
Vacant | July 8, 2022 – July 15, 2022 | |||
Jack Nichols ( Raleigh ) | Democratic | July 15, 2022 – January 1, 2023 | Appointed to finish Martin's term. Retired. | |
![]() Tim Longest ( Raleigh ) | Democratic | January 1, 2023 – Present |
Party | Candidate | Votes | % | |
---|---|---|---|---|
Democratic | Tim Longest (incumbent) | 33,839 | 75.79% | |
Libertarian | Ed George | 10,808 | 24.21% | |
Total votes | 44,647 | 100% | ||
Democratic hold |
Party | Candidate | Votes | % | |
---|---|---|---|---|
Republican | Ashley Seshul | 3,907 | 70.79% | |
Republican | Joshua Jordan | 1,612 | 29.21% | |
Total votes | 5,519 | 100% |
Party | Candidate | Votes | % | |
---|---|---|---|---|
Democratic | Tim Longest [14] | 24,413 | 60.27% | |
Republican | Ashley Seshul | 14,853 | 36.67% | |
Libertarian | Kat McDonald | 1,240 | 3.06% | |
Total votes | 40,506 | 100% | ||
Democratic hold |
Party | Candidate | Votes | % | |
---|---|---|---|---|
Democratic | Grier Martin (incumbent) | 31,784 | 56.53% | |
Republican | Ronald L. Smith | 21,989 | 39.11% | |
Libertarian | Michael C. Munger | 2,449 | 4.36% | |
Total votes | 56,222 | 100% | ||
Democratic hold |
Party | Candidate | Votes | % | |
---|---|---|---|---|
Democratic | Grier Martin (incumbent) | 26,348 | 65.51% | |
Republican | Catherine Whiteford | 12,903 | 32.08% | |
Libertarian | Cap Hayes | 970 | 2.41% | |
Total votes | 40,221 | 100% | ||
Democratic hold |
Party | Candidate | Votes | % | |
---|---|---|---|---|
Democratic | Grier Martin (incumbent) | 31,335 | 67.56% | |
Republican | Bill Morris | 15,049 | 32.44% | |
Total votes | 46,384 | 100% | ||
Democratic hold |
Party | Candidate | Votes | % | |
---|---|---|---|---|
Democratic | Grier Martin (incumbent) | 22,929 | 100% | |
Total votes | 22,929 | 100% | ||
Democratic hold |
Party | Candidate | Votes | % | |
---|---|---|---|---|
Democratic | Deborah Ross (incumbent) | 32,206 | 97.37% | |
Write-in | 521 | 1.58% | ||
Unaffaliated | Apryl Major (write-in) | 348 | 1.05% | |
Total votes | 33,075 | 100% | ||
Democratic hold |
Party | Candidate | Votes | % | |
---|---|---|---|---|
Republican | Steve Henion | 1,637 | 45.40% | |
Republican | Brian Tinga | 1,231 | 34.14% | |
Republican | J. H. Ross | 495 | 13.73% | |
Republican | Jamie Earp | 243 | 6.74% | |
Total votes | 3,606 | 100% |
Party | Candidate | Votes | % | |
---|---|---|---|---|
Democratic | Grier Martin (incumbent) | 15,234 | 54.17% | |
Republican | Steve Henion | 12,886 | 45.83% | |
Total votes | 28,120 | 100% | ||
Democratic hold |
Party | Candidate | Votes | % | |
---|---|---|---|---|
Democratic | Grier Martin (incumbent) | 24,065 | 59.91% | |
Republican | J. H. Ross | 16,102 | 40.09% | |
Total votes | 40,167 | 100% | ||
Democratic hold |
Party | Candidate | Votes | % | |
---|---|---|---|---|
Democratic | Grier Martin (incumbent) | 13,596 | 59.13% | |
Republican | J. H. Ross | 9,396 | 40.87% | |
Total votes | 22,992 | 100% | ||
Democratic hold |
Party | Candidate | Votes | % | |
---|---|---|---|---|
Republican | Don Munford (incumbent) | 3,833 | 76.01% | |
Republican | J. H. Ross | 1,210 | 23.99% | |
Total votes | 5,043 | 100% |
Party | Candidate | Votes | % | |
---|---|---|---|---|
Democratic | Grier Martin | 18,755 | 51.09% | |
Republican | Don Munford (incumbent) | 17,952 | 48.91% | |
Total votes | 36,707 | 100% | ||
Democratic gain from Republican |
Party | Candidate | Votes | % | |
---|---|---|---|---|
Republican | Don Munford | 3,688 | 62.96% | |
Republican | Albert Nelson Nunn | 1,948 | 33.25% | |
Republican | J. H. Ross | 222 | 3.79% | |
Total votes | 5,858 | 100% |
Party | Candidate | Votes | % | |
---|---|---|---|---|
Republican | Don Munford | 15,998 | 57.82% | |
Democratic | Cynthia Barnett | 10,767 | 38.91% | |
Libertarian | Victor Marks | 905 | 3.27% | |
Total votes | 27,670 | 100% | ||
Republican hold |
Party | Candidate | Votes | % | |
---|---|---|---|---|
Republican | Fern Shubert | 1,900 | 71.81% | |
Republican | Ed Price | 746 | 28.19% | |
Total votes | 2,646 | 100% |
Party | Candidate | Votes | % | |
---|---|---|---|---|
Republican | Fern Shubert | 13,117 | 53.71% | |
Democratic | O. Max Melton (incumbent) | 11,306 | 46.29% | |
Total votes | 24,423 | 100% | ||
Republican gain from Democratic |