North Carolina's 90th State House of Representatives district | |||
---|---|---|---|
![]() | |||
Representative |
| ||
Demographics | 86% White 3% Black 8% Hispanic 1% Asian 1% Multiracial | ||
Population (2020) | 79,679 |
North Carolina's 90th House district is one of 120 districts in the North Carolina House of Representatives. It has been represented by Republican Sarah Stevens since 2009. [1]
Since 2023, the district has included all of Surry County, as well as part of Wilkes County. The district overlaps with the 36th Senate district.
Representative | Party | Dates | Notes | Counties |
---|---|---|---|---|
District created January 1, 1993. | 1993–2003 Part of Cabarrus County. [2] | |||
![]() Robin Hayes ( Concord ) | Republican | January 1, 1993 – January 1, 1997 | Retired to run for Governor. | |
Richard Moore ( Kannapolis ) | Democratic | January 1, 1997 – May 7, 2000 | Resigned. | |
Vacant | May 7, 2000 – May 17, 2000 | |||
Len Sossamon ( Concord ) | Democratic | May 17, 2000 – January 1, 2001 | Appointed to finish Moore's term. Lost re-election. | |
![]() Linda Johnson ( Kannapolis ) | Republican | January 1, 2001 – January 1, 2003 | Redistricted to the 74th district. | |
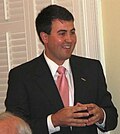
![]() Jim Harrell ( Elkin ) | Democratic | January 1, 2003 – January 1, 2009 | Lost re-election. | 2003–2013 All of Alleghany County. Part of Surry County. [3] [4] |
![]() Sarah Stevens ( Mount Airy ) | Republican | January 1, 2009 – Present | ||
2013–2019 All of Surry County. Part of Wilkes County. [5] | ||||
2019–2023 All of Alleghany County. Parts of Surry and Wilkes counties. [6] [7] | ||||
2023–Present All of Surry County. Part of Wilkes County. [8] [9] |
Party | Candidate | Votes | % | |
---|---|---|---|---|
Republican | Sarah Stevens (incumbent) | 35,674 | 77.90% | |
Democratic | Ken Badgett | 10,119 | 22.10% | |
Total votes | 45,793 | 100% | ||
Republican hold |
Party | Candidate | Votes | % | |
---|---|---|---|---|
Republican | Sarah Stevens (incumbent) | 6,526 | 72.43% | |
Republican | Benjamin Romans | 2,484 | 27.57% | |
Total votes | 9,010 | 100% |
Party | Candidate | Votes | % | |
---|---|---|---|---|
Republican | Sarah Stevens (incumbent) | 24,398 | 100% | |
Total votes | 24,398 | 100% | ||
Republican hold |
Party | Candidate | Votes | % | |
---|---|---|---|---|
Republican | Sarah Stevens (incumbent) | 30,028 | 74.57% | |
Democratic | Beth Shaw | 10,242 | 25.43% | |
Total votes | 40,270 | 100% | ||
Republican hold |
Party | Candidate | Votes | % | |
---|---|---|---|---|
Republican | Sarah Stevens (incumbent) | 4,060 | 66.57% | |
Republican | Allen Poindexter | 2,039 | 33.43% | |
Total votes | 6,099 | 100% |
Party | Candidate | Votes | % | |
---|---|---|---|---|
Republican | Sarah Stevens (incumbent) | 18,373 | 68.35% | |
Democratic | John Worth Wiles | 7,170 | 26.68% | |
Constitution | Allen Poindexter | 1,336 | 4.97% | |
Total votes | 26,879 | 100% | ||
Republican hold |
Party | Candidate | Votes | % | |
---|---|---|---|---|
Republican | Sarah Stevens (incumbent) | 23,678 | 73.26% | |
Democratic | Vera Smith Reynolds | 8,641 | 26.74% | |
Total votes | 32,319 | 100% | ||
Republican hold |
Party | Candidate | Votes | % | |
---|---|---|---|---|
Republican | Sarah Stevens (incumbent) | 13,440 | 68.25% | |
Democratic | John Worth Wiles | 6,251 | 31.75% | |
Total votes | 19,691 | 100% | ||
Republican hold |
Party | Candidate | Votes | % | |
---|---|---|---|---|
Republican | Sarah Stevens (incumbent) | 23,153 | 100% | |
Total votes | 23,153 | 100% | ||
Republican hold |
Party | Candidate | Votes | % | |
---|---|---|---|---|
Republican | Sarah Stevens (incumbent) | 12,274 | 71.10% | |
Democratic | Randy Wolfe | 4,988 | 28.90% | |
Total votes | 17,262 | 100% | ||
Republican hold |
Party | Candidate | Votes | % | |
---|---|---|---|---|
Republican | Sarah Stevens | 13,263 | 50.58% | |
Democratic | Jim Harrell (incumbent) | 12,957 | 49.42% | |
Total votes | 26,220 | 100% | ||
Republican gain from Democratic |
Party | Candidate | Votes | % | |
---|---|---|---|---|
Democratic | Jim Harrell (incumbent) | 9,533 | 60.93% | |
Republican | Jack Conway | 6,114 | 39.07% | |
Total votes | 15,647 | 100% | ||
Democratic hold |
Party | Candidate | Votes | % | |
---|---|---|---|---|
Democratic | Jim Harrell (incumbent) | 13,374 | 57.97% | |
Republican | Jack Conaway | 9,698 | 42.03% | |
Total votes | 23,072 | 100% | ||
Democratic hold |
Party | Candidate | Votes | % | |
---|---|---|---|---|
Democratic | Jim Harrell | 3,282 | 57.25% | |
Democratic | Melvin T. Jackson | 1,457 | 25.41% | |
Democratic | Todd Harris | 994 | 17.34% | |
Total votes | 5,733 | 100% |
Party | Candidate | Votes | % | ||
---|---|---|---|---|---|
Democratic | Jim Harrell | 9,395 | 52.75% | ||
Republican | R. F. Buck Golding | 8,415 | 47.25% | ||
Total votes | 17,810 | 100% | |||
Democratic win (new seat) |
Party | Candidate | Votes | % | |
---|---|---|---|---|
Republican | Linda Johnson | 13,988 | 53.77% | |
Democratic | Len Sossamon (incumbent) | 12,025 | 46.23% | |
Total votes | 26,013 | 100% | ||
Republican gain from Democratic |