Related Research Articles
In statistics, survey sampling describes the process of selecting a sample of elements from a target population to conduct a survey. The term "survey" may refer to many different types or techniques of observation. In survey sampling it most often involves a questionnaire used to measure the characteristics and/or attitudes of people. Different ways of contacting members of a sample once they have been selected is the subject of survey data collection. The purpose of sampling is to reduce the cost and/or the amount of work that it would take to survey the entire target population. A survey that measures the entire target population is called a census. A sample refers to a group or section of a population from which information is to be obtained
An opinion poll, often simply referred to as a poll or a survey, is a human research survey of public opinion from a particular sample. Opinion polls are usually designed to represent the opinions of a population by conducting a series of questions and then extrapolating generalities in ratio or within confidence intervals. A person who conducts polls is referred to as a pollster.
A straw poll, straw vote, or straw ballot is an ad hoc or unofficial vote. It is used to show the popular opinion on a certain matter, and can be used to help politicians know the majority opinion and help them decide what to say in order to gain votes.
An election exit poll is a poll of voters taken immediately after they have exited the polling stations. A similar poll conducted before actual voters have voted is called an entrance poll. Pollsters – usually private companies working for newspapers or broadcasters – conduct exit polls to gain an early indication as to how an election has turned out, as in many elections the actual result may take hours or even months to count.

The 2007 Ontario general election was held on October 10, 2007, to elect members (MPPs) of the 39th Legislative Assembly of the Province of Ontario, Canada. The Liberals under Premier Dalton McGuinty won the election with a majority government, winning 71 out of a possible 107 seats with 42.2% of the popular vote. The election set a record for the lowest voter turnout in an Ontario provincial election; only 52.8% people who were eligible voted. This broke the previous record of 54.7% in the 1923 election.
An open-access poll is a type of opinion poll in which a nonprobability sample of participants self-select into participation. The term includes call-in, mail-in, and some online polls.

Opinion polling in the Canadian federal election of 2006 showed a long period of variable support for the governing Liberal Party of Canada and opposition Conservative Party of Canada. Prior to and throughout much of the campaign, the Liberals held a small lead over the Conservatives; as of early January 2006, the Conservatives had taken the lead. This was confirmed on election day when the Conservatives won a plurality of votes and seats, being empowered to form a minority government in the 39th Canadian parliament.
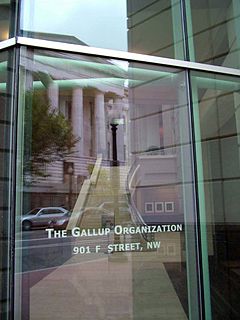
Gallup, Inc. is an American analytics and advisory company based in Washington, D.C. Founded by George Gallup in 1935, the company became known for its public opinion polls conducted worldwide. Starting in the 1980s, Gallup transitioned its business to focus on providing analytics and management consulting to organizations globally. In addition to its analytics, management consulting, and Gallup Poll, the company also offers educational consulting, the CliftonStrengths assessment and associated products, and business and management books published by its Gallup Press unit.

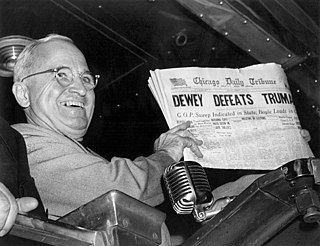
The Bradley effect is a theory concerning observed discrepancies between voter opinion polls and election outcomes in some United States government elections where a white candidate and a non-white candidate run against each other. The theory proposes that some white voters who intend to vote for the white candidate would nonetheless tell pollsters that they are undecided or likely to vote for the non-white candidate. It was named after Los Angeles Mayor Tom Bradley, an African-American who lost the 1982 California governor's race despite being ahead in voter polls going into the elections.

In the run up to the general election on 7 May 2015, various organisations carried out opinion polling to gauge voting intention. Results of such polls are displayed in this article. Most of the polling companies listed are members of the British Polling Council (BPC) and abide by its disclosure rules.
This article provides a list of federal opinion polls that were conducted between the 2007 election and 2010 election.
Survation is a polling and market research agency based in London, England. Survation have been conducting research surveys since 2010. Surveys are conducted via telephone, online panel and face to face as well as omnibus research for a broad range of clients including television, newspapers, charities, lobby groups, trade unions, law firms and political parties. Damian Lyons Lowe is the company founder and Chief Executive.
This table provides a list of scientific, nationwide public opinion polls that were conducted from the 2011 Canadian federal election leading up to the 2015 Canadian federal election, which was held on October 19, 2015. For riding-specific polls see 2015 constituency polls.
This page lists the public opinion polls that were conducted in relation to the 2014 Scottish independence referendum, that was held on 18 September 2014. Overall, polls showed that support for a "No" vote was dominant until the end of August 2014, when support for a "Yes" vote gained momentum and the gap closed significantly, with at least one poll placing the "Yes" vote ahead. In the final week of the campaign, polls showed the "No" vote to be consistently but somewhat narrowly ahead. There were no exit polls although a YouGov post-election poll was published shortly after the polls closed. For the history of the campaign itself see 2014 Scottish independence referendum, Yes Scotland, and Better Together (campaign).
Various polling organisations have been conducting opinion polling in specific ridings in the lead up to the 2015 Canadian general election. The results of publicised opinion polling for individual constituencies are detailed in this article.
This page provides a list of scientific, nationwide public opinion polls that were conducted from the 2015 Canadian federal election leading up to the 2019 Canadian federal election, which was held on October 21. For riding-specific polls see 2019 constituency polls.
This page lists public opinion polls that have been conducted in relation to the issue of Scottish independence. A referendum on the subject was held on 18 September 2014.

General elections are scheduled to be held in Pakistan less than 60 days after the dissolution of the National Assembly, which is set to dissolve on 13 August 2023, unless dissolved earlier: in which case the election shall be held within 90 days after dissolution. This means that the election must be held by or before 12 October 2023.
Various polling organizations have been conducting opinion polling in specific ridings in the lead up to the 2019 Canadian federal election. The results of publicized opinion polling for individual constituencies are detailed in this article.
This table provides a list of scientific, nationwide public opinion polls that were conducted from the 2019 Canadian federal election leading up to the 44th Canadian federal election, scheduled to take place on or before October 16, 2023.
References
- ↑ "MRIA Responds to "Evaluating the Polls: An Open Letter to Ontario's Journalists"". Marketing Research and Intelligence Association. September 16, 2011. Retrieved October 6, 2012.
- ↑ American Association for Public Opinion Research (undated), Best Practices for Survey and Public Opinion Research Archived 2014-11-30 at the Wayback Machine , retrieved October 17, 2012