Phenotypic disparity

Last updated

The phenotypic disparity, also known as morphological diversity, morphological variety, morphological disparity, morphodisparity or simply disparity, refers to the phenotypic differentiation within groups. It was originally proposed in paleontology, and has also been introduced into the study of extant organisms. Some biologists view phenotypic disparity as an important aspect of biodiversity, while others believe that they are two different concepts.

Contents

History

Biologists' interest in phenotypic disparity predates the formal concept. Douglas Erwin argued that it had been central to the organismal biology since Georges Cuvier, who utilized it as a criterion for animal classification. However, prior to the development of quantitative methods for measuring disparity, the disparity recognized within the Linnaean taxonomy faced criticism for being unnatural. [1]

This concept was first proposed in the 1980s, utilized to explore the evolutionary patterns of variation in anatomy, function, and ecology. [2] It arose from the efforts by paleobiologists to define the evolutionary origins of the body plans of animals and by comparative developmental biologists to offer causal explanations for the emergence of these body plans. [2] In 1989, Stephen Jay Gould published Wonderful Life , in which he used the fossils from the Middle Cambrian Burgess Shale to contend that the ancient arthropods at this site has a greater phenotypic disparity than all living arthropods. [1] This concept has been introduced into the study of extant organisms. [3] [4]

Initially, phenotypic disparity was considered a sub-concept of biodiversity, referred to as "morphological diversity", [5] subsequently it acquired its own name "disparity", also known as "phenotypic disparity", "morphological disparity", "morphological variety" or "morphodisparity". [3]

Summary

In the narrower sense, the currently widely accepted concept of biodiversity meant only the taxonomic diversity, or the species richness. However, some groups have a large number of species, while all of them are very similar in morphology; other groups have very little species, while they are highly heterogeneous. For example, birds, with more than 10,000 species, have greater species richness than mammals, which have approximately 5,600 species. However, birds are relatively more uniform in morphology, reproductive biology, and developmental biology. Even including some rare groups, such as penguins and ratites (ostriches and their relatives), the range of body plans in birds is much narrower than in mammals, which include apes, whales, bats, giraffes, moles, the platypus, marsupials and armadillos. Therefore, relying only on species richness to represent biodiversity is less comprehensive. [6]

The disparity is defined as the phenotypic differentiation within groups. [4] [7] "Groups" usually refers to the taxonomic groups, including species or higher taxa. [7] Some biologists believe that the concept of disparity should also be applied to other groups, including sexes, ages, biomorphs and the castes of social insects. [8]

Disparity has changed at different rates and independently of species richness in the evolutionary history. There are two main patterns in how disparity develops over time. Some groups have developed high disparity early on in their evolution (called "early-disparity"), while others take longer to reach their maximum disparity (called "later-disparity"). The early-disparity boom may happen because species quickly explore new habitats or take advantage of new ecological niches. On the other hand, later-disparity groups may have develop new morphological forms slowly, resulting in a delay in reaching their maximum disparity. [5]

Measuring disparity

The morphospace of the plant kingdom. Taxa with higher disparity occupy larger areas. Plant kingdom morphospace.webp
The morphospace of the plant kingdom. Taxa with higher disparity occupy larger areas.

Initially, there was no consensus on how to measure disparity. [9] Taxonomic metrics was an early approach of measuring disparity among groups. It started in the 1980s and involved counting how many different families or genera there were to measuring the diversity and disparity of them. It was based on the assumption that higher-ranked taxa could represent specific morphological innovations. Although this approach was criticized as it relied on artificial and non-monophyletic taxa, it provided valuable insights into the evolution of disparity. Some conclusions have been confirmed by subsequent quantitative measuring of disparity. [1]

Currently, disparity is usually quantified using the morphospace, which is a multidimensional space covering the morphological variation within a taxon. [10] Due to the use of different mathematical tools, morphospaces may have different geometric structures and mathematical meanings. [11]

The initial step involves selecting multiple phenotypic descriptors (characteristics described in appropriate ways) that vary among different taxa. [7] All phenotypic characteristics can be used to evaluate the disparity of a group, but the morphological characteristics are mostly used, because they are more accessible than others. [6] Secondly, use the selected descriptors to construct a morphospace. Then, use standard statistical dispersion indicators, such as total range or total variance, to describe the dispersion and distribution of groups in morphospace. The morphospace is a multidimensional space, which is almost impossible to visualize, so the dimensionality of the morphospace should be reduced using principal component analysis, principal coordinate analysis, nonmetric multidimensional scaling, or other mathematical methods. Therefore, it could be projected onto a two-dimensional space to visualize it. [7]

Related Research Articles

<span class="mw-page-title-main">Clade</span> Group of a common ancestor and all descendants

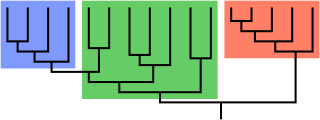
In biological phylogenetics, a clade, also known as a monophyletic group or natural group, is a grouping of organisms that are monophyletic – that is, composed of a common ancestor and all its lineal descendants – on a phylogenetic tree. In the taxonomical literature, sometimes the Latin form cladus is used rather than the English form. Clades are the fundamental unit of cladistics, a modern approach to taxonomy adopted by most biological fields.

Macroevolution usually means the evolution of large-scale structures and traits that go significantly beyond the intraspecific variation found in microevolution. In other words, macroevolution is the evolution of taxa above the species level.

<span class="mw-page-title-main">Lobopodia</span> Group of extinct worm-like animals with legs

Lobopodians are members of the informal group Lobopodia, or the formally erected phylum Lobopoda Cavalier-Smith (1998). They are panarthropods with stubby legs called lobopods, a term which may also be used as a common name of this group as well. While the definition of lobopodians may differ between literatures, it usually refers to a group of soft-bodied, marine worm-like fossil panarthropods such as Aysheaia and Hallucigenia.

<span class="mw-page-title-main">Evolutionary developmental biology</span> Comparison of organism developmental processes

Evolutionary developmental biology is a field of biological research that compares the developmental processes of different organisms to infer how developmental processes evolved.

<span class="mw-page-title-main">Panarthropoda</span> Animal taxon

Panarthropoda is a proposed animal clade containing the extant phyla Arthropoda, Tardigrada and Onychophora. Panarthropods also include extinct marine legged worms known as lobopodians ("Lobopodia"), a paraphyletic group where the last common ancestor and basal members (stem-group) of each extant panarthropod phylum are thought to have risen. However the term "Lobopodia" is sometimes expanded to include tardigrades and onychophorans as well.

<span class="mw-page-title-main">Morphometrics</span> Quantitative study of size and shape

Morphometrics or morphometry refers to the quantitative analysis of form, a concept that encompasses size and shape. Morphometric analyses are commonly performed on organisms, and are useful in analyzing their fossil record, the impact of mutations on shape, developmental changes in form, covariances between ecological factors and shape, as well for estimating quantitative-genetic parameters of shape. Morphometrics can be used to quantify a trait of evolutionary significance, and by detecting changes in the shape, deduce something of their ontogeny, function or evolutionary relationships. A major objective of morphometrics is to statistically test hypotheses about the factors that affect shape.

<span class="mw-page-title-main">Carcinisation</span> Evolution of crustaceans into crab-like forms

Carcinisation is a form of convergent evolution in which non-crab crustaceans evolve a crab-like body plan. The term was introduced into evolutionary biology by L. A. Borradaile, who described it as "the many attempts of Nature to evolve a crab".

<span class="mw-page-title-main">Canalisation (genetics)</span> Measure of the ability of a population to produce the same phenotype

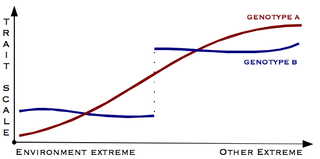
Canalisation is a measure of the ability of a population to produce the same phenotype regardless of variability of its environment or genotype. It is a form of evolutionary robustness. The term was coined in 1942 by C. H. Waddington to capture the fact that "developmental reactions, as they occur in organisms submitted to natural selection...are adjusted so as to bring about one definite end-result regardless of minor variations in conditions during the course of the reaction". He used this word rather than robustness to consider that biological systems are not robust in quite the same way as, for example, engineered systems.

Plicatoperipatus is a monospecific genus of velvet worm containing the single species Plicatoperipatus jamaicensis. It is endemic to Jamaica. Females of this species can have as many as 43 pairs of legs, the maximum number found in the phylum Onychophora. In a large sample collected in 1988, however, females ranged from 35 to 39 leg pairs, with 37 as the mean and the most common number, and males ranged from 31 to 37 leg pairs, with 35 as the mean and the most common number. This species ranges from 25 mm to 65 mm in length. In the 1988 sample, the mean length for males was 33 mm, and the mean length for mature females was 51 mm. This species is viviparous, with mothers supplying nourishment to their embryos through a placenta.

<span class="mw-page-title-main">Marine invertebrates</span> Marine animals without a vertebrate column

Marine invertebrates are the invertebrates that live in marine habitats. Invertebrate is a blanket term that includes all animals apart from the vertebrate members of the chordate phylum. Invertebrates lack a vertebral column, and some have evolved a shell or a hard exoskeleton. As on land and in the air, marine invertebrates have a large variety of body plans, and have been categorised into over 30 phyla. They make up most of the macroscopic life in the oceans.

<span class="mw-page-title-main">Global biodiversity</span> Total variability of Earths life forms

Global biodiversity is the measure of biodiversity on planet Earth and is defined as the total variability of life forms. More than 99 percent of all species that ever lived on Earth are estimated to be extinct. Estimates on the number of Earth's current species range from 2 million to 1 trillion, but most estimates are around 11 million species or fewer. About 1.74 million species were databased as of 2018, and over 80 percent have not yet been described. The total amount of DNA base pairs on Earth, as a possible approximation of global biodiversity, is estimated at 5.0 x 1037, and weighs 50 billion tonnes. In comparison, the total mass of the biosphere has been estimated to be as much as 4 TtC (trillion tons of carbon).

<span class="mw-page-title-main">Phylum</span> High level taxonomic rank for organisms sharing a similar body plan

In biology, a phylum is a level of classification or taxonomic rank below kingdom and above class. Traditionally, in botany the term division has been used instead of phylum, although the International Code of Nomenclature for algae, fungi, and plants accepts the terms as equivalent. Depending on definitions, the animal kingdom Animalia contains about 31 phyla, the plant kingdom Plantae contains about 14 phyla, and the fungus kingdom Fungi contains about 8 phyla. Current research in phylogenetics is uncovering the relationships among phyla within larger clades like Ecdysozoa and Embryophyta.

<span class="mw-page-title-main">Species</span> Basic unit of taxonomic classification, below genus

A species is often defined as the largest group of organisms in which any two individuals of the appropriate sexes or mating types can produce fertile offspring, typically by sexual reproduction. It is the basic unit of classification and a taxonomic rank of an organism, as well as a unit of biodiversity. Other ways of defining species include their karyotype, DNA sequence, morphology, behaviour, or ecological niche. In addition, paleontologists use the concept of the chronospecies since fossil reproduction cannot be examined. The most recent rigorous estimate for the total number of species of eukaryotes is between 8 and 8.7 million. About 14% of these had been described by 2011. All species are given a two-part name, a "binomial". The first part of a binomial is the genus to which the species belongs. The second part is called the specific name or the specific epithet. For example, Boa constrictor is one of the species of the genus Boa, with constrictor being the species' epithet.

A variety of objective means exist to empirically measure biodiversity. Each measure relates to a particular use of the data, and is likely to be associated with the variety of genes. Biodiversity is commonly measured in terms of taxonomic richness of a geographic area over a time interval. In order to calculate biodiversity, species evenness, species richness, and species diversity are to be obtained first. Species evenness is the relative number of individuals of each species in a given area. Species richness is the number of species present in a given area. Species diversity is the relationship between species evenness and species richness. There are many ways to measure biodiversity within a given ecosystem. However, the two most popular are Shannon-Weaver diversity index, commonly referred to as Shannon diversity index, and the other is Simpsons diversity index. Although many scientists prefer to use Shannon's diversity index simply because it takes into account species richness.

<span class="mw-page-title-main">Avalon explosion</span> Proposed evolutionary event in the history of metazoa, producing the Ediacaran biota

The Avalon explosion, named from the Precambrian faunal trace fossils discovered on the Avalon Peninsula in Newfoundland, eastern Canada, is a proposed evolutionary radiation of prehistoric animals about 575 million years ago in the Ediacaran period, with the Avalon explosion being one of three eras grouped in this time period. This evolutionary event is believed to have occurred some 33 million years earlier than the Cambrian explosion, which had been long thought to be when complex life started on Earth.

<span class="mw-page-title-main">Outline of evolution</span> Overview of and topical guide to change in the heritable characteristics of organisms

The following outline is provided as an overview of and topical guide to evolution:

In evolutionary biology, developmental bias refers to the production against or towards certain ontogenetic trajectories which ultimately influence the direction and outcome of evolutionary change by affecting the rates, magnitudes, directions and limits of trait evolution. Historically, the term was synonymous with developmental constraint, however, the latter has been more recently interpreted as referring solely to the negative role of development in evolution.

<i>Collinsovermis</i> Extinct genus of lobopodians

Collinsovermis is a genus of extinct panarthropod belonging to the group Lobopodia and known from the middle Cambrian Burgess Shale in British Columbia, Canada. It is monotypic having only one species, Collinsovermis monstruosus. After its initial discovery in 1983, Desmond H. Collins popularised it as a unique animal and was subsequently dubbed "Collins' monster" for its unusual super armoured body. The formal scientific description and name were given in 2020.

<i>Acinocricus</i> Extinct genus of lobopodians

Acinocricus is a genus of extinct panarthropod belonging to the group Lobopodia and known from the middle Cambrian Spence Shale of Utah, United States. As a monotypic genus, it has one species Acinocricus stichus. The only lobopodian discovered from the Spence Shale, it was described by Simon Conway Morris and Richard A. Robison in 1988. Owing to the original fragmentary fossils discovered since 1982, it was initially classified as an alga, but later realised to be an animal belonging to Cambrian fauna.

Luolishania is an extinct genus of lobopodian panarthropod and known from the Lower Cambrian Chiungchussu Formation of the Chengjiang County, Yunnan Province, China. A monotypic genus, it contains one species Luolishania longicruris. It was discovered and described by Hou Xian-Guang and Chen Jun-Yuan in 1989. It is one of the superarmoured Cambrian lobopodians suspected to be either an intermediate form in the origin of velvet worms (Onychophora) or basal to at least Tardigrada and Arthropoda. It is the basis of the family name Luolishaniidae, which also include other related lobopods such as Acinocricus, Collinsium, Facivermis, and Ovatiovermis. Along with Microdictyon, it is the first lobopodian fossil discovered from China.

References

  1. 1 2 3 Erwin, Douglas H. (2007). "Disparity: Morphological pattern and developmental context" . Palaeontology. 50 (1): 57–73. Bibcode:2007Palgy..50...57E. doi:10.1111/j.1475-4983.2006.00614.x. ISSN   0031-0239. Archived from the original on 18 September 2023. Retrieved 11 May 2024.
  2. 1 2 Guillerme, Thomas; Cooper, Natalie; Brusatte, Stephen L.; Davis, Katie E.; Jackson, Andrew L.; Gerber, Sylvain; Goswami, Anjali; Healy, Kevin; Hopkins, Melanie J.; Jones, Marc E. H.; Lloyd, Graeme T.; O'Reilly, Joseph E.; Pate, Abi; Puttick, Mark N.; Rayfield, Emily J. (2020). "Disparities in the analysis of morphological disparity". Biology Letters. 16 (7): 20200199. doi:10.1098/rsbl.2020.0199. ISSN   1744-9561. PMC   7423048 . PMID   32603646.
  3. 1 2 Oyston, Jack W.; Hughes, Martin; Gerber, Sylvain; Wills, Matthew A. (2016). "Why should we investigate the morphological disparity of plant clades?". Annals of Botany. 117 (5): 859–879. doi:10.1093/aob/mcv135. ISSN   0305-7364. PMC   4845799 . PMID   26658292.
  4. 1 2 3 Clark, James W.; Hetherington, Alexander J.; Morris, Jennifer L.; Pressel, Silvia; Duckett, Jeffrey G.; Puttick, Mark N.; Schneider, Harald; Kenrick, Paul; Wellman, Charles H.; Donoghue, Philip C. J. (2023). "Evolution of phenotypic disparity in the plant kingdom". Nature Plants. 9 (10): 1618–1626. doi:10.1038/s41477-023-01513-x. ISSN   2055-0278. PMC   10581900 . PMID   37666963.
  5. 1 2 López-Martínez, Andrea M.; Magallón, Susana; von Balthazar, Maria; Schönenberger, Jürg; Sauquet, Hervé; Chartier, Marion (2024). "Angiosperm flowers reached their highest morphological diversity early in their evolutionary history". New Phytologist. 241 (3): 1348–1360. doi:10.1111/nph.19389. ISSN   0028-646X. PMC   10952840 . PMID   38029781.
  6. 1 2 Minelli, Alessandro (2019). "Biodiversity, disparity and evolvability". In Casetta, Elena; da Silva, Jorge Marques; Vecchi, Davide (eds.). From assessing to conserving biodiversity: Conceptual and practical challenges. History, Philosophy and Theory of the Life Sciences. Vol. 24. Switzerland: Springer Open. pp. 233–246. doi:10.1007/978-3-030-10991-2_11. ISBN   978-3-030-10990-5. Archived from the original on 19 February 2024. Retrieved 13 May 2024.
  7. 1 2 3 4 Hopkins, Melanie J.; Gerber, Sylvain (2017), Nuno de la Rosa, Laura; Müller, Gerd (eds.), "Morphological Disparity" , Evolutionary Developmental Biology: A Reference Guide, Cham: Springer International Publishing, pp. 1–12, doi:10.1007/978-3-319-33038-9_132-1, ISBN   978-3-319-33038-9, archived from the original on 13 May 2024, retrieved 8 May 2024
  8. Pavlinov, Igor (2008). "Morphological disparity: general conceptions and basic characteristics". Archive of Zoological Museum of Moscow University (in Russian). 48: 343–388. ISSN   0134-8647.
  9. Wills, Matthew A.; Briggs, Derek E. G.; Fortey, Richard A. (1994). "Disparity as an evolutionary index: a comparison of Cambrian and Recent arthropods" . Paleobiology. 20 (2): 93–130. Bibcode:1994Pbio...20...93W. doi:10.1017/S009483730001263X. ISSN   0094-8373. Archived from the original on 8 May 2024. Retrieved 8 May 2024.
  10. McClain, Craig R.; Johnson, Nicholas A.; Rex, Michael A. (2004). "Morphological disparity as a biodiversity metric in lower bathyal and abyssal gastropod assemblages". Evolution. 58 (2): 338–348. doi:10.1111/j.0014-3820.2004.tb01649.x. PMID   15068350.
  11. Gerber, Sylvain (2017). "The geometry of morphospaces: lessons from the classic R aup shell coiling model" . Biological Reviews. 92 (2): 1142–1155. doi:10.1111/brv.12276. ISSN   1464-7931. PMID   27151556. Archived from the original on 21 March 2023. Retrieved 12 May 2024.