Process-data diagram

Last updated
The process data diagram Process-Data Diagram 01.jpg
The process data diagram

A process-data diagram (PDD), also known as process-deliverable diagram is a diagram that describes processes and data that act as output of these processes. On the left side the meta-process model can be viewed and on the right side the meta-data model can be viewed. [1]

Contents

A process-data diagram can be seen as combination of a business process model and data model.

Overview

SAP Implementation process-data diagram SAP Implementation process-data diagram.png
SAP Implementation process-data diagram

The process-data diagram that is depicted at the right, gives an overview of all of these activities/processes and deliverables. The four gray boxes depict the four main implementation phases, which each contain several processes that are in this case all sequential. The boxes at the right show all the deliverables/concepts that result from the processes. Boxes without a shadow have no further sub-concepts. Boxes with a black shadow depict complex closed concepts, so concepts that have sub-concepts, which however will not be described in any more detail. Boxes with a white shadow (a box behind it) depict open closed concepts, where the sub-concepts are expanded in greater detail. The lines with diamonds show a has-a relationship between concepts.

The SAP Implementation process is made up out of four main phases, i.e. the project preparation where a vision of the future-state of the SAP solution is being created, a sizing and blueprinting phase where a software stack is acquired and training is being performed, a functional development phase and finally a final preparation phase, when the last tests are being performed before the actual go live. For each phase, the vital activities are addressed and the deliverables/products are explained.

Process-data diagram building blocks

Sequential activities

Sequential activities are activities that need to be carried out in a pre-defined order. The activities are connected with an arrow, implying that they have to be followed in that sequence. Both activities and sub-activities can be modeled in a sequential way. In Figure 1 an activity diagram is illustrated with one activity and two sequential sub-activities. A special kind of sequential activities are the start and stop states, which are also illustrated in Figure 1.

In Figure 2 an example from practice is illustrated. The example is taken from the requirements capturing workflow in UML-based Web Engineering. The main activity, user & domain modeling, consists of three activities that need to be carried out in a predefined order.

Unordered activities

Unordered activities are used when sub-activities of an activity do not have a pre-defined sequence in which they need to be carried out. Only sub-activities can be unordered. Unordered activities are represented as sub-activities without transitions within an activity, as is represented in Figure 3.

Sometimes an activity consists of both sequential and unordered sub-activities. The solution to this modeling issue is to divide the main activity in different parts. In Figure 4 an example is illustrated, which clarifies the necessity to be able to model unordered activities. The example is taken from the requirements analysis workflow of the Unified Process. The main activity, “describe candidate requirements”, is divided into two parts. The first part is a sequential activity. The second part consists of four activities that do not need any sequence in order to be carried out correctly.

Concurrent activities

Activities can occur concurrently. This is handled with forking and joining. By drawing the activities parallel in the diagram, connected with a synchronization bar, one can fork several activities. Later on these concurrent activities can join again by using the same synchronization bar. Both activities and sub-activities can occur concurrently. In the example of Figure 5, Activity 2 and Activity 3 are concurrent activities.

In Figure 6, a fragment of a requirements capturing process is depicted. Two activities, defining the actors and defining the use cases, are carried out concurrently. The reason for carrying out these activities concurrently is that defining the actors influences the use cases greatly, and vice versa.

Conditional activities

Conditional activities are activities that are only carried out if a pre-defined condition is met. This is graphically represented by using a branch. Branches are illustrated with a diamond and can have incoming and outgoing transitions. Every outgoing transition has a guard expression, the condition. This guard expression is actually a Boolean expression, used to make a choice which direction to go. Both activities and sub-activities can be modeled as conditional activities. In Figure 7 two conditional activities are illustrated.

In Figure 8 an example from practice is illustrated. A requirements analysis starts with studying the material. Based on this study, the decision is taken whether to do an extensive requirements elicitation session or not. The condition for not carrying out this requirements session is represented at the left of the branch, namely [requirements clear]. If this condition is not met, [else], the other arrow is followed.

The integration of both types of diagrams is quite straightforward. Each action or activity results in a concept. They are connected with a dotted arrow to the produced artifacts, as is demonstrated in Figure 9. The concepts and activities are abstract in this picture.

Figure 9: Process-Data Diagram Mm41.gif
Figure 9: Process-Data Diagram

In Table 1 a generic table is presented with the description of activities, sub-activities and their relations to the concepts. In section 5 examples are given of both process-data diagram and activity table.

ActivitySub-ActivityDescription
Activity 2Sub-activity 4Sub-activity 4 results in a STANDARD CONCEPT
Table 1: Activity table

Example of a process-data diagram

In Figure 10 an example of a process-data diagram is illustrated. It concerns an example from the orientation phase of complex project in a WebEngineering method. [1]

Notable is the use of open and closed concepts. Since project management is actually not within the scope of this research, the concept CONTROL MANAGEMENT has not been expanded. However, in a complex project is RISK MANAGEMENT of great importance. Therefore, the choice is made to expand the RISK MANAGEMENT concept.

Figure 10: Example Process-Data Diagram - Orientation phase in a complex project Process-Data Diagram 41.gif
Figure 10: Example Process-Data Diagram - Orientation phase in a complex project

In Table 2 the activities and sub-activities, and relation to the concepts are described.

ActivitySub-ActivityDescription
Describe ProjectDescribing the project is done in terms of participants, targets, products, scope and assumptions. This information is derived from the proposal, but with more emphasis on the project management issues. The activity end in a project DESCRIPTION.
Construct planningDescribe project phasesThe PLANNING is divided into five PROJECT PHASES, which should be shortly described.
Construct planningDescribe activitiesThe project ACTIVITIES are described and grouped into PROJECT PHASES.
Construct planningDescribe deliverablesThe DELIVERABLES that result from the project ACTIVITIES are described.
Construct planningSet up scheduleFor every DELIVERABLE a DATE is set and for each ACTIVITY a TIME SLOT is estimated.
Control projectControlling the project results in a CONTROL MANAGEMENT artifact. This artifact is not further explained here, since it concerns regular project management issues, like communication management, progress management, change management and problem management that lie outside the scope of this research.
Control riskIdentify risksIdentifying risks can be done by using standard checklists or organizing risk workshops. The RISKS are included in the PROJECT PLAN.
Control riskEvaluate risksEvery RISK is provided with an EVALUATION; a description and estimation about the complexity or uncertainty of a project is given.
Control riskAnalyze impactAnalyzing the impact of a risk handles about the IMPACT, a risk has on the success of a project. The evaluation and risk values are indicated by selecting a value: low, moderate or high.
Control riskPrioritize risksPrioritizing the risks is done by combining IMPACT and EVALUATION in a table. High priority is then given to RISKS with the highest scores.
Define actions for risk strategyRisk strategy actions can be obtained from experience or from relevant literature. The project manager adapts the actions to the project in the ACTION LIST FOR RISK STRATEGY. RISKS with the highest priority are on top of the list and need to be handled first.
Table 2: Activities and sub-activities in a complex orientation phase

See also

Related Research Articles

<span class="mw-page-title-main">Data model</span> Abstract model

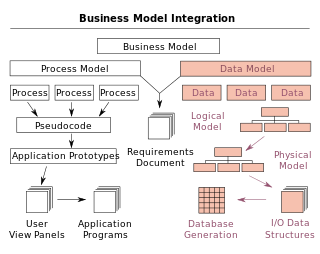
A data model is an abstract model that organizes elements of data and standardizes how they relate to one another and to the properties of real-world entities. For instance, a data model may specify that the data element representing a car be composed of a number of other elements which, in turn, represent the color and size of the car and define its owner.

<span class="mw-page-title-main">Spiral model</span> Software development process model

The spiral model is a risk-driven software development process model. Based on the unique risk patterns of a given project, the spiral model guides a team to adopt elements of one or more process models, such as incremental, waterfall, or evolutionary prototyping.

<span class="mw-page-title-main">System context diagram</span> Engineering diagram displaying high level system-environment relationships

A system context diagram in engineering is a diagram that defines the boundary between the system, or part of a system, and its environment, showing the entities that interact with it. This diagram is a high level view of a system. It is similar to a block diagram.

<span class="mw-page-title-main">Systems development life cycle</span> Systems engineering terms

In systems engineering, information systems and software engineering, the systems development life cycle (SDLC), also referred to as the application development life cycle, is a process for planning, creating, testing, and deploying an information system. The SDLC concept applies to a range of hardware and software configurations, as a system can be composed of hardware only, software only, or a combination of both. There are usually six stages in this cycle: requirement analysis, design, development and testing, implementation, documentation, and evaluation.

<span class="mw-page-title-main">Product lifecycle</span> Duration of processing of products from inception, to engineering, design & manufacture

In industry, product lifecycle management (PLM) is the process of managing the entire lifecycle of a product from its inception through the engineering, design and manufacture, as well as the service and disposal of manufactured products. PLM integrates people, data, processes, and business systems and provides a product information backbone for companies and their extended enterprises.

<span class="mw-page-title-main">Business process modeling</span> Activity of representing processes of an enterprise

Business process modeling (BPM), mainly used in business process management; software development, or systems engineering, is the action of capturing and representing processes of an enterprise, so that the current business processes may be analyzed, applied securely and consistently, improved, and automated. BPM is typically orchestrated by business analysts, leveraging their expertise in modeling practices. Subject matter experts, equipped with specialized knowledge of the processes being modeled, often collaborate within these teams. Alternatively, process models can be directly derived from digital traces within IT systems, such as event logs, utilizing process mining tools.

A technology roadmap is a flexible planning schedule to support strategic and long-range planning, by matching short-term and long-term goals with specific technology solutions. It is a plan that applies to a new product or process and may include using technology forecasting or technology scouting to identify suitable emerging technologies. It is a known technique to help manage the fuzzy front-end of innovation. It is also expected that roadmapping techniques may help companies to survive in turbulent environments and help them to plan in a more holistic way to include non-financial goals and drive towards a more sustainable development. Here roadmaps can be combined with other corporate foresight methods to facilitate systemic change.

Feature-driven development (FDD) is an iterative and incremental software development process. It is a lightweight or Agile method for developing software. FDD blends several industry-recognized best practices into a cohesive whole. These practices are driven from a client-valued functionality (feature) perspective. Its main purpose is to deliver tangible, working software repeatedly in a timely manner in accordance with the Principles behind the Agile Manifesto.

<span class="mw-page-title-main">Business Process Model and Notation</span> Graphical representation for specifying business processes

Business Process Model and Notation (BPMN) is a graphical representation for specifying business processes in a business process model.

Synchronization Models, also known as Configuration Management Models, describe methods to enable revision control through allowing simultaneous, concurrent changes to individual files.

The implementation maturity model (IMM) is an instrument to help an organization in assessing and determining the degree of maturity of its implementation processes.

ITIL security management describes the structured fitting of security into an organization. ITIL security management is based on the ISO 27001 standard. "ISO/IEC 27001:2005 covers all types of organizations. ISO/IEC 27001:2005 specifies the requirements for establishing, implementing, operating, monitoring, reviewing, maintaining and improving a documented Information Security Management System within the context of the organization's overall business risks. It specifies requirements for the implementation of security controls customized to the needs of individual organizations or parts thereof. ISO/IEC 27001:2005 is designed to ensure the selection of adequate and proportionate security controls that protect information assets and give confidence to interested parties."

Parallel adoption is a method for transferring between a previous (IT) system to a target (IT) system in an organization. In order to reduce risk, the old and new system run simultaneously for some period of time after which, if the criteria for the new system are met, the old system is disabled. The process requires careful planning and control and a significant investment in labor hours.

Internet-Speed development is an Agile Software Development development method using a combined spiral model/waterfall model with daily builds aimed at developing a product with high speed.

Product-family engineering (PFE), also known as product-line engineering, is based on the ideas of "domain engineering" created by the Software Engineering Institute, a term coined by James Neighbors in his 1980 dissertation at University of California, Irvine. Software product lines are quite common in our daily lives, but before a product family can be successfully established, an extensive process has to be followed. This process is known as product-family engineering.

The change request management process in systems engineering is the process of requesting, determining attainability, planning, implementing, and evaluating of changes to a system. Its main goals are to support the processing and traceability of changes to an interconnected set of factors.

Metadata modeling is a type of metamodeling used in software engineering and systems engineering for the analysis and construction of models applicable to and useful for some predefined class of problems.

<span class="mw-page-title-main">Function model</span>

In systems engineering, software engineering, and computer science, a function model or functional model is a structured representation of the functions within the modeled system or subject area.

<span class="mw-page-title-main">Functional flow block diagram</span> Flow Diagram

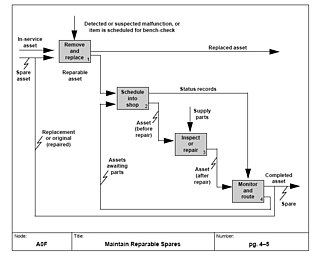
A functional flow block diagram (FFBD) is a multi-tier, time-sequenced, step-by-step flow diagram of a system's functional flow. The term "functional" in this context is different from its use in functional programming or in mathematics, where pairing "functional" with "flow" would be ambiguous. Here, "functional flow" pertains to the sequencing of operations, with "flow" arrows expressing dependence on the success of prior operations. FFBDs may also express input and output data dependencies between functional blocks, as shown in figures below, but FFBDs primarily focus on sequencing.

In software engineering, a software development process or software development life cycle (SDLC) is a process of planning and managing software development. It typically involves dividing software development work into smaller, parallel, or sequential steps or sub-processes to improve design and/or product management. The methodology may include the pre-definition of specific deliverables and artifacts that are created and completed by a project team to develop or maintain an application.

References

  1. 1 2 I. Van de Weerd, J. Souer, J. Versendaal and Sjaak Brinkkemper (2005). Situational Requirements Engineering of Web Content Management Implementations. SREP2005.