
A digital elevation model (DEM) or digital surface model (DSM) is a 3D computer graphics representation of elevation data to represent terrain or overlaying objects, commonly of a planet, moon, or asteroid. A "global DEM" refers to a discrete global grid. DEMs are used often in geographic information systems (GIS), and are the most common basis for digitally produced relief maps. A digital terrain model (DTM) represents specifically the ground surface while DEM and DSM may represent tree top canopy or building roofs.

The Voyager Golden Records are two identical phonograph records, one of each which was included aboard the two Voyager spacecraft launched in 1977. The records contain sounds and images selected to portray the diversity of life and culture on Earth, and are intended for any intelligent extraterrestrial life form who may find them. The records are a time capsule.
Flexible Image Transport System (FITS) is an open standard defining a digital file format useful for storage, transmission and processing of data: formatted as multi-dimensional arrays, or tables. FITS is the most commonly used digital file format in astronomy. The FITS standard was designed specifically for astronomical data, and includes provisions such as describing photometric and spatial calibration information, together with image origin metadata.

Information design is the practice of presenting information in a way that fosters an efficient and effective understanding of the information. The term has come to be used for a specific area of graphic design related to displaying information effectively, rather than just attractively or for artistic expression. Information design is closely related to the field of data visualization and is often taught as part of graphic design courses. The broad applications of information design along with its close connections to other fields of design and communication practices have created some overlap in the definitions of communication design, data visualization, and information architecture.

R is a programming language for statistical computing and graphics supported by the R Core Team and the R Foundation for Statistical Computing. Created by statisticians Ross Ihaka and Robert Gentleman, R is used among data miners, bioinformaticians and statisticians for data analysis and developing statistical software. The core R language is augmented by a large number of extension packages containing reusable code and documentation.

ArcGIS is a family of client, server and online geographic information system (GIS) software developed and maintained by Esri.

Data and information visualization is the practice of designing and creating easy-to-communicate and easy-to-understand graphic or visual representations of a large amount of complex quantitative and qualitative data and information with the help of static, dynamic or interactive visual items. Typically based on data and information collected from a certain domain of expertise, these visualizations are intended for a broader audience to help them visually explore and discover, quickly understand, interpret and gain important insights into otherwise difficult-to-identify structures, relationships, correlations, local and global patterns, trends, variations, constancy, clusters, outliers and unusual groupings within data. When intended for the general public to convey a concise version of known, specific information in a clear and engaging manner, it is typically called information graphics.

3D Systems, headquartered in Rock Hill, South Carolina, is a company that engineers, manufactures, and sells 3D printers, 3D printing materials, 3D scanners, and offers a 3D printing service. The company creates product concept models, precision and functional prototypes, master patterns for tooling, as well as production parts for direct digital manufacturing. It uses proprietary processes to fabricate physical objects using input from computer-aided design and manufacturing software, or 3D scanning and 3D sculpting devices.

WorldWide Telescope (WWT) is an open-source set of applications, data and cloud services, originally created by Microsoft Research but now an open source project hosted on GitHub. The .NET Foundation holds the copyright and the project is managed by the American Astronomical Society and has been supported by grants from the Moore Foundation and National Science Foundation. WWT displays astronomical, earth and planetary data allowing visual navigation through the 3-dimensional (3D) Universe. Users are able to navigate the sky by panning and zooming, or explore the 3D universe from the surface of Earth to past the Cosmic microwave background (CMB), viewing both visual imagery and scientific data about that area and the objects in it. Data is curated from hundreds of different data sources, but its open data nature allows users to explore any third party data that conforms to a WWT supported format. With the rich source of multi-spectral all-sky images it is possible to view the sky in many wavelengths of light. The software utilizes Microsoft's Visual Experience Engine technologies to function. WWT can also be used to visualize arbitrary or abstract data sets and time series data.

In 3D computer graphics, 3D modeling is the process of developing a mathematical coordinate-based representation of any surface of an object in three dimensions via specialized software by manipulating edges, vertices, and polygons in a simulated 3D space.

The NASA Exoplanet Archive is an online astronomical exoplanet catalog and data service that collects and serves public data that support the search for and characterization of extra-solar planets (exoplanets) and their host stars. It is part of the Infrared Processing and Analysis Center and is on the campus of the California Institute of Technology (Caltech) in Pasadena, CA. The archive is funded by NASA and was launched in early December 2011 by the NASA Exoplanet Science Institute as part of NASA's Exoplanet Exploration Program. In June 2019, the archive's collection of confirmed exoplanets surpassed 4,000.

The 3Doodler is a 3D pen developed by Peter Dilworth, Maxwell Bogue, and Daniel Cowen of WobbleWorks, Inc.. The 3Doodler works by extruding heated plastic that cools almost instantly into a solid, stable structure, allowing for the free-hand creation of three-dimensional objects. It utilizes plastic thread made of either acrylonitrile butadiene styrene ("ABS"), polylactic acid ("PLA"), or “FLEXY”, thermal polyurethane (“TPU”) that is melted and then cooled through a patented process while moving through the pen, which can then be used to make 3D objects by hand. The 3Doodler has been described as a glue gun for 3D printing because of how the plastic is extruded from the tip, with one foot of the plastic thread equaling "about 11 feet of extruded material".

CARTO is a software as a service (SaaS) cloud computing platform that provides GIS, web mapping, and spatial data science tools. The company is positioned as a Location Intelligence platform due to tools with an aptitude for data analysis and visualization that do not require previous GIS or development experience.

The Museum of Science Fiction (MOSF) is a 501c(3) nonprofit museum that originally had plans to be based in Washington, D.C. It was founded in the spring of 2013 by Greg Viggiano and a team of 22 volunteer professionals with a goal of becoming the world's first comprehensive science fiction museum.
Stamen is a data visualization design studio based in San Francisco, California. Its clients include National Geographic, Facebook and The Dalai Lama.

César A. Hidalgo is a Chilean born, Chilean-Spanish-American physicist, author, and entrepreneur. He directs the Center for Collective Learning at the Artificial and Natural Intelligence Institute (ANITI) of the University of Toulouse. He is also an Honorary Professor at the University of Manchester, and is a visiting professor at Harvard's School of Engineering and Applied Sciences. Hidalgo is known for work on Economic Complexity, Relatedness, Data Visualization, Applied Artificial Intelligence, and Digital Democracy. Prior to joining the University of Toulouse, Hidalgo was a professor at MIT where he directed the Collective Learning group. He is also a founder and partner at Datawheel, a data visualization and distribution company.

Giorgia Lupi is an Italian information designer, a partner at design firm Pentagram, and co-founder of research and design firm Accurat. She is a co-author of Dear Data, a collection of hand drawn data visualizations, along with information designer Stefanie Posavec. Her work is also part of the permanent collection at the Museum of Modern Art.
NASA's Eyes Visualization is a freely available suite of computer visualization applications created by the Visualization Technology Applications and Development Team at NASA's Jet Propulsion Laboratory (JPL) to render scientifically accurate views of the planets studied by JPL missions and the spacecraft used in that study. The Eyes family of products is available for desktop computers running Windows 7+, and Mac OSX 10.8+. Deep Space Network Now and Experience Curiosity are web-based and available across all platforms. 3D models of spacecraft and other objects are displayed with the option of comparing their size to a human, school bus, or football stadium.

A climate spiral is an animated data visualization graphic designed as a "simple and effective demonstration of the progression of global warming", especially for general audiences.
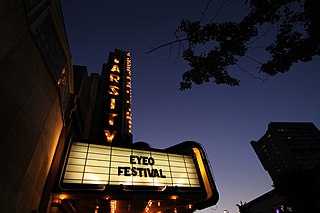
The Eyeo Festival is a yearly conference for artists who work with data and code. It takes place in Minneapolis. The conference began in 2011, and has taken place yearly since then, typically at the Walker Art Center. Due to the COVID-19 pandemic, the event was put on pause for 2020 and 2021. Eyeo returned to Minneapolis in 2022, but was later put back on hiatus for 2023. There have been no updates on if/when Eyeo will be return.
