
The Schmidt net is a manual drafting method for the Lambert azimuthal equal-area projection using graph paper. It results in one lateral hemisphere of the Earth with the grid of parallels and meridians. The method is common in geoscience.
The Schmidt net is a manual drafting method for the Lambert azimuthal equal-area projection using graph paper. It results in one lateral hemisphere of the Earth with the grid of parallels and meridians. The method is common in geoscience.
In the figure, the area-preserving property of the projection can be seen by comparing a grid sector near the center of the net with one at the far right of the net. The two sectors have the same area on the sphere and the same area on the disk. The angle-distorting property can be seen by examining the grid lines; most of them do not intersect at right angles on the Schmidt net. A single Schmidt net can only represent one hemisphere of the earth; typically a pair of Schmidt nets is used to represent both sides of the globe.
It is relatively simple to re-plot a gridded map of the world onto a Schmidt net if the azimuth is chosen to be the junction of the equator with any particular meridian from the world-map's grid. Each grid square surrounding this chosen longitude is simply re-plotted into the corresponding distorted grid-square in the Schmidt net. Points of latitude-longitude can be plotted relative to the azimuth's longitude, interpolating between grid lines in the Schmidt net. For greater accuracy, it is helpful to have a net with finer spacing than 10°; spacings of 2° are common.

The Schmidt net is not an appropriate grid for representing the Earth's northern or southern hemisphere (because the lines would not correspond to meridians or parallels in such a projection). However, it can be used as a scalar measuring device for projecting latitude-longitude points onto a blank circle of the same size, to produce a Lambert equal-area projection with the azimuth at the north or south pole. The intersection of the parallels with the outer circle can be used as a de facto protractor for plotting a point's longitude as the angle in the polar projection. The Schmidt net's horizontal axis can then be used as a scalar measuring device to convert the point's latitude (relative to the pole) into a radial distance from the centre of the circle. Alternatively, the Schmidt net could be replaced entirely with a correctly projected polar grid, and grid squares from a map re-drawn into this disc.
Researchers in structural geology use the Lambert azimuthal projection to plot lineation and foliation in rocks, slickensides in faults, and other linear and planar features. In this context the projection is called the equal-area hemispherical projection. The Schmidt net is often used to sketch out the Lambert azimuthal projection for these purposes. [1] Conversely, the Wulff net ("equal-angle projection") is used to plot crystallographic axes and faces.
{{cite book}}: CS1 maint: multiple names: authors list (link)
In geography, latitude is a coordinate that specifies the north–south position of a point on the surface of the Earth or another celestial body. Latitude is given as an angle that ranges from −90° at the south pole to 90° at the north pole, with 0° at the Equator. Lines of constant latitude, or parallels, run east–west as circles parallel to the equator. Latitude and longitude are used together as a coordinate pair to specify a location on the surface of the Earth.

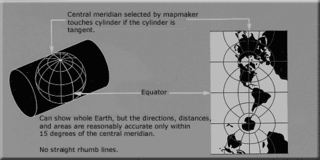
The Mercator projection is a conformal cylindrical map projection presented by Flemish geographer and cartographer Gerardus Mercator in 1569. It became the standard map projection for navigation due to its ability to represent north as 'up' and south as 'down' everywhere while preserving local directions and shapes. However, as a result, the Mercator projection inflates the size of objects the further they are from the equator. In a Mercator projection, landmasses such as Greenland and Antarctica appear far larger than they actually are relative to landmasses near the equator. Despite these drawbacks, the Mercator projection is well-suited to marine navigation and internet web maps and continues to be widely used today.

A geographic coordinate system (GCS) is a spherical or geodetic coordinate system for measuring and communicating positions directly on the Earth as latitude and longitude. It is the simplest, oldest and most widely used of the various spatial reference systems that are in use, and forms the basis for most others. Although latitude and longitude form a coordinate tuple like a cartesian coordinate system, the geographic coordinate system is not cartesian because the measurements are angles and are not on a planar surface.
In cartography, a map projection is any of a broad set of transformations employed to represent the curved two-dimensional surface of a globe on a plane. In a map projection, coordinates, often expressed as latitude and longitude, of locations from the surface of the globe are transformed to coordinates on a plane. Projection is a necessary step in creating a two-dimensional map and is one of the essential elements of cartography.
A circle of latitude or line of latitude on Earth is an abstract east–west small circle connecting all locations around Earth at a given latitude coordinate line.

In mathematics, a stereographic projection is a perspective projection of the sphere, through a specific point on the sphere, onto a plane perpendicular to the diameter through the point. It is a smooth, bijective function from the entire sphere except the center of projection to the entire plane. It maps circles on the sphere to circles or lines on the plane, and is conformal, meaning that it preserves angles at which curves meet and thus locally approximately preserves shapes. It is neither isometric nor equiareal.

In navigation, a rhumb line, rhumb, or loxodrome is an arc crossing all meridians of longitude at the same angle, that is, a path with constant bearing as measured relative to true north.
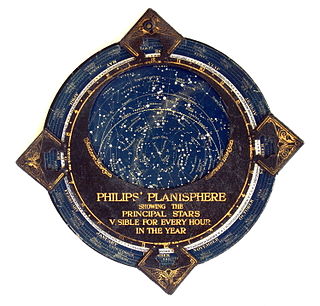
In astronomy, a planisphere is a star chart analog computing instrument in the form of two adjustable disks that rotate on a common pivot. It can be adjusted to display the visible stars for any time and date. It is an instrument to assist in learning how to recognize stars and constellations. The astrolabe, an instrument that has its origins in Hellenistic astronomy, is a predecessor of the modern planisphere. The term planisphere contrasts with armillary sphere, where the celestial sphere is represented by a three-dimensional framework of rings.
The transverse Mercator map projection is an adaptation of the standard Mercator projection. The transverse version is widely used in national and international mapping systems around the world, including the Universal Transverse Mercator. When paired with a suitable geodetic datum, the transverse Mercator delivers high accuracy in zones less than a few degrees in east-west extent.

Orthographic projection in cartography has been used since antiquity. Like the stereographic projection and gnomonic projection, orthographic projection is a perspective projection in which the sphere is projected onto a tangent plane or secant plane. The point of perspective for the orthographic projection is at infinite distance. It depicts a hemisphere of the globe as it appears from outer space, where the horizon is a great circle. The shapes and areas are distorted, particularly near the edges.

The azimuthal equidistant projection is an azimuthal map projection. It has the useful properties that all points on the map are at proportionally correct distances from the center point, and that all points on the map are at the correct azimuth (direction) from the center point. A useful application for this type of projection is a polar projection which shows all meridians as straight, with distances from the pole represented correctly.

A gnomonic projection, also known as a central projection or rectilinear projection, is a perspective projection of a sphere, with center of projection at the sphere's center, onto any plane not passing through the center, most commonly a tangent plane. Under gnomonic projection every great circle on the sphere is projected to a straight line in the plane. More generally, a gnomonic projection can be taken of any n-dimensional hypersphere onto a hyperplane.

The scale of a map is the ratio of a distance on the map to the corresponding distance on the ground. This simple concept is complicated by the curvature of the Earth's surface, which forces scale to vary across a map. Because of this variation, the concept of scale becomes meaningful in two distinct ways.

The equirectangular projection, and which includes the special case of the plate carrée projection, is a simple map projection attributed to Marinus of Tyre, who Ptolemy claims invented the projection about AD 100.

The sinusoidal projection is a pseudocylindrical equal-area map projection, sometimes called the Sanson–Flamsteed or the Mercator equal-area projection. Jean Cossin of Dieppe was one of the first mapmakers to use the sinusoidal, appearing in a world map of 1570.

A Lambert conformal conic projection (LCC) is a conic map projection used for aeronautical charts, portions of the State Plane Coordinate System, and many national and regional mapping systems. It is one of seven projections introduced by Johann Heinrich Lambert in his 1772 publication Anmerkungen und Zusätze zur Entwerfung der Land- und Himmelscharten.

The Lambert azimuthal equal-area projection is a particular mapping from a sphere to a disk. It accurately represents area in all regions of the sphere, but it does not accurately represent angles. It is named for the Swiss mathematician Johann Heinrich Lambert, who announced it in 1772. "Zenithal" being synonymous with "azimuthal", the projection is also known as the Lambert zenithal equal-area projection.
In cartography, a conformal map projection is one in which every angle between two curves that cross each other on Earth is preserved in the image of the projection; that is, the projection is a conformal map in the mathematical sense. For example, if two roads cross each other at a 39° angle, their images on a map with a conformal projection cross at a 39° angle.

In cartography, the normal cylindrical equal-area projection is a family of normal cylindrical, equal-area map projections.

The stereographic projection, also known as the planisphere projection or the azimuthal conformal projection, is a conformal map projection whose use dates back to antiquity. Like the orthographic projection and gnomonic projection, the stereographic projection is an azimuthal projection, and when on a sphere, also a perspective projection.
| Authority control databases: National |
|---|