Serial analysis of gene expression

Last updated
Summary of SAGE. Within the organisms, genes are transcribed and spliced (in eukaryotes) to produce mature mRNA transcripts (red). The mRNA is extracted from the organism, and reverse transcriptase is used to copy the mRNA into stable double-stranded-cDNA (ds-cDNA; blue). In SAGE, the ds-cDNA is digested by restriction enzymes (at location 'X' and 'X'+11) to produce 11-nucleotide 'tag' fragments. These tags are concatenated and sequenced using long-read Sanger sequencing (different shades of blue indicate tags from different genes). The sequences are deconvoluted to find the frequency of each tag. The tag frequency can be used to report on transcription of the gene that the tag came from. Summary of SAGE.svg
Summary of SAGE. Within the organisms, genes are transcribed and spliced (in eukaryotes) to produce mature mRNA transcripts (red). The mRNA is extracted from the organism, and reverse transcriptase is used to copy the mRNA into stable double-stranded–cDNA (ds-cDNA; blue). In SAGE, the ds-cDNA is digested by restriction enzymes (at location 'X' and 'X'+11) to produce 11-nucleotide 'tag' fragments. These tags are concatenated and sequenced using long-read Sanger sequencing (different shades of blue indicate tags from different genes). The sequences are deconvoluted to find the frequency of each tag. The tag frequency can be used to report on transcription of the gene that the tag came from.

Serial Analysis of Gene Expression (SAGE) is a transcriptomic technique used by molecular biologists to produce a snapshot of the messenger RNA population in a sample of interest in the form of small tags that correspond to fragments of those transcripts. Several variants have been developed since, most notably a more robust version, LongSAGE, [2] RL-SAGE [3] and the most recent SuperSAGE. [4] Many of these have improved the technique with the capture of longer tags, enabling more confident identification of a source gene.

Contents

Overview

Briefly, SAGE experiments proceed as follows:

  1. The mRNA of an input sample (e.g. a tumour) is isolated and a reverse transcriptase and biotinylated primers are used to synthesize cDNA from mRNA.
  2. The cDNA is bound to Streptavidin beads via interaction with the biotin attached to the primers, and is then cleaved using a restriction endonuclease called an anchoring enzyme (AE). The location of the cleavage site and thus the length of the remaining cDNA bound to the bead will vary for each individual cDNA (mRNA).
  3. The cleaved cDNA downstream from the cleavage site is then discarded, and the remaining immobile cDNA fragments upstream from cleavage sites are divided in half and exposed to one of two adaptor oligonucleotides (A or B) containing several components in the following order upstream from the attachment site: 1) Sticky ends with the AE cut site to allow for attachment to cleaved cDNA; 2) A recognition site for a restriction endonuclease known as the tagging enzyme (TE), which cuts about 15 nucleotides downstream of its recognition site (within the original cDNA/mRNA sequence); 3) A short primer sequence unique to either adaptor A or B, which will later be used for further amplification via PCR.
  4. After adaptor ligation, cDNA are cleaved using TE to remove them from the beads, leaving only a short "tag" of about 11 nucleotides of original cDNA (15 nucleotides minus the 4 corresponding to the AE recognition site).
  5. The cleaved cDNA tags are then repaired with DNA polymerase to produce blunt end cDNA fragments.
  6. These cDNA tag fragments (with adaptor primers and AE and TE recognition sites attached) are ligated, sandwiching the two tag sequences together, and flanking adaptors A and B at either end. These new constructs, called ditags, are then PCR amplified using anchor A and B specific primers.
  7. The ditags are then cleaved using the original AE, and allowed to link together with other ditags, which will be ligated to create a cDNA concatemer with each ditag being separated by the AE recognition site.
  8. These concatemers are then transformed into bacteria for amplification through bacterial replication.
  9. The cDNA concatemers can then be isolated and sequenced using modern high-throughput DNA sequencers, and these sequences can be analysed with computer programs which quantify the recurrence of individual tags.

Analysis

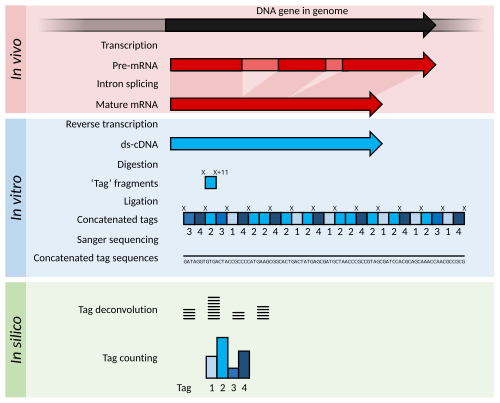
The output of SAGE is a list of short sequence tags and the number of times it is observed. Using sequence databases a researcher can usually determine, with some confidence, from which original mRNA (and therefore which gene) the tag was extracted.

Statistical methods can be applied to tag and count lists from different samples in order to determine which genes are more highly expressed. For example, a normal tissue sample can be compared against a corresponding tumor to determine which genes tend to be more (or less) active.

History

In 1979 teams at Harvard and Caltech extended the basic idea of making DNA copies of mRNAs in vitro to amplifying a library of such in bacterial plasmids. [5] In 1982–1983, the idea of selecting random or semi-random clones from such a cDNA library for sequencing was explored by Greg Sutcliffe and coworkers. [6] and Putney et al. who sequenced 178 clones from a rabbit muscle cDNA library. [7] In 1991 Adams and co-workers coined the term expressed sequence tag (EST) and initiated more systematic sequencing of cDNAs as a project (starting with 600 brain cDNAs). [8] The identification of ESTs proceeded rapidly, millions of ESTs now available in public databases (e.g. GenBank).

In 1995, the idea of reducing the tag length from 100 to 800 bp down to tag length of 10 to 22 bp helped reduce the cost of mRNA surveys. [9] In this year, the original SAGE protocol was published by Victor Velculescu at the Oncology Center of Johns Hopkins University. [9] Although SAGE was originally conceived for use in cancer studies, it has been successfully used to describe the transcriptome of other diseases and in a wide variety of organisms.

Comparison to DNA microarrays

The general goal of the technique is similar to the DNA microarray. However, SAGE sampling is based on sequencing mRNA output, not on hybridization of mRNA output to probes, so transcription levels are measured more quantitatively than by microarray. In addition, the mRNA sequences do not need to be known a priori, so genes or gene variants which are not known can be discovered. Microarray experiments are much cheaper to perform, so large-scale studies do not typically use SAGE. Quantifying gene expressions is more exact in SAGE because it involves directly counting the number of transcripts whereas spot intensities in microarrays fall in non-discrete gradients and are prone to background noise.

Variant protocols

miRNA cloning

MicroRNAs, or miRNAs for short, are small (~22nt) segments of RNA which have been found to play a crucial role in gene regulation. One of the most commonly used methods for cloning and identifying miRNAs within a cell or tissue was developed in the Bartel Lab and published in a paper by Lau et al. (2001). Since then, several variant protocols have arisen, but most have the same basic format. The procedure is quite similar to SAGE: The small RNA are isolated, then linkers are added to each, and the RNA is converted to cDNA by RT-PCR. Following this, the linkers, containing internal restriction sites, are digested with the appropriate restriction enzyme and the sticky ends are ligated together into concatamers. Following concatenation, the fragments are ligated into plasmids and are used to transform bacteria to generate many copies of the plasmid containing the inserts. Those may then be sequenced to identify the miRNA present, as well as analysing expression levels of a given miRNA by counting the number of times it is present, similar to SAGE.

LongSAGE and RL-SAGE

LongSAGE was a more robust version of the original SAGE developed in 2002 which had a higher throughput, using 20 μg of mRNA to generate a cDNA library of thousands of tags. [10] Robust LongSage (RL-SAGE) Further improved on the LongSAGE protocol with the ability to generate a library with an insert size of 50 ng mRNA, much smaller than previous LongSAGE insert size of 2 μg mRNA [10] and using a lower number of ditag polymerase chain reactions (PCR) to obtain a complete cDNA library. [11]

SuperSAGE

SuperSAGE is a derivative of SAGE that uses the type III-endonuclease EcoP15I of phage P1, to cut 26 bp long sequence tags from each transcript's cDNA, expanding the tag-size by at least 6 bp as compared to the predecessor techniques SAGE and LongSAGE. [12] The longer tag-size allows for a more precise allocation of the tag to the corresponding transcript, because each additional base increases the precision of the annotation considerably.

Like in the original SAGE protocol, so-called ditags are formed, using blunt-ended tags. However, SuperSAGE avoids the bias observed during the less random LongSAGE 20 bp ditag-ligation. [13] By direct sequencing with high-throughput sequencing techniques (next-generation sequencing, i.e. pyrosequencing), hundred thousands or millions of tags can be analyzed simultaneously, producing very precise and quantitative gene expression profiles. Therefore, tag-based gene expression profiling also called "digital gene expression profiling" (DGE) can today provide most accurate transcription profiles that overcome the limitations of microarrays. [14] [15]

3'end mRNA sequencing, massive analysis of cDNA ends

In the mid 2010s several techniques combined with Next Generation Sequencing were developed that employ the "tag" principle for "digital gene expression profiling" but without the use of the tagging enzyme. The "MACE" approach, (=Massive Analysis of cDNA Ends) generates tags somewhere in the last 1500 bps of a transcript. The technique does not depend on restriction enzymes anymore and thereby circumvents bias that is related to the absence or location of the restriction site within the cDNA. Instead, the cDNA is randomly fragmented and the 3'ends are sequenced from the 5' end of the cDNA molecule that carries the poly-A tail. The sequencing length of the tag can be freely chosen. Because of this, the tags can be assembled into contigs and the annotation of the tags can be drastically improved. Therefore, MACE is also use for the analyses of non-model organisms. In addition, the longer contigs can be screened for polymorphisms. As UTRs show a large number of polymorphisms between individuals, the MACE approach can be applied for allele determination, allele specific gene expression profiling and the search for molecular markers for breeding. In addition, the approach allows determining alternative polyadenylation of the transcripts. Because MACE does only require 3’ ends of transcripts, even partly degraded RNA can be analyzed with less degradation dependent bias. The MACE approach uses unique molecular identifiers to allow for identification of PCR bias. [16]

See also

Related Research Articles

<span class="mw-page-title-main">Complementary DNA</span> Single-stranded DNA synthesized from RNA

In genetics, complementary DNA (cDNA) is DNA synthesized from a single-stranded RNA template in a reaction catalyzed by the enzyme reverse transcriptase. cDNA is often used to express a specific protein in a cell that does not normally express that protein, or to sequence or quantify mRNA molecules using DNA based methods. cDNA that codes for a specific protein can be transferred to a recipient cell for expression, often bacterial or yeast expression systems. cDNA is also generated to analyze transcriptomic profiles in bulk tissue, single cells, or single nuclei in assays such as microarrays, qPCR, and RNA-seq.

In genetics, an expressed sequence tag (EST) is a short sub-sequence of a cDNA sequence. ESTs may be used to identify gene transcripts, and were instrumental in gene discovery and in gene-sequence determination. The identification of ESTs has proceeded rapidly, with approximately 74.2 million ESTs now available in public databases. EST approaches have largely been superseded by whole genome and transcriptome sequencing and metagenome sequencing.

<span class="mw-page-title-main">Functional genomics</span> Field of molecular biology

Functional genomics is a field of molecular biology that attempts to describe gene functions and interactions. Functional genomics make use of the vast data generated by genomic and transcriptomic projects. Functional genomics focuses on the dynamic aspects such as gene transcription, translation, regulation of gene expression and protein–protein interactions, as opposed to the static aspects of the genomic information such as DNA sequence or structures. A key characteristic of functional genomics studies is their genome-wide approach to these questions, generally involving high-throughput methods rather than a more traditional "candidate-gene" approach.

The transcriptome is the set of all RNA transcripts, including coding and non-coding, in an individual or a population of cells. The term can also sometimes be used to refer to all RNAs, or just mRNA, depending on the particular experiment. The term transcriptome is a portmanteau of the words transcript and genome; it is associated with the process of transcript production during the biological process of transcription.

Rapid amplification of cDNA ends (RACE) is a technique used in molecular biology to obtain the full length sequence of an RNA transcript found within a cell. RACE results in the production of a cDNA copy of the RNA sequence of interest, produced through reverse transcription, followed by PCR amplification of the cDNA copies. The amplified cDNA copies are then sequenced and, if long enough, should map to a unique genomic region. RACE is commonly followed up by cloning before sequencing of what was originally individual RNA molecules. A more high-throughput alternative which is useful for identification of novel transcript structures, is to sequence the RACE-products by next generation sequencing technologies.

<span class="mw-page-title-main">RNA spike-in</span>

An RNA spike-in is an RNA transcript of known sequence and quantity used to calibrate measurements in RNA hybridization assays, such as DNA microarray experiments, RT-qPCR, and RNA-Seq.

Trans-Spliced Exon Coupled RNA End Determination (TEC-RED) is a transcriptomic technique that, like SAGE, allows for the digital detection of messenger RNA sequences. Unlike SAGE, detection and purification of transcripts from the 5’ end of the messenger RNA require the presence of a trans-spliced leader sequence.

<span class="mw-page-title-main">RNA-Seq</span> Lab technique in cellular biology

RNA-Seq is a sequencing technique that uses next-generation sequencing (NGS) to reveal the presence and quantity of RNA in a biological sample, representing an aggregated snapshot of the cells' dynamic pool of RNAs, also known as transcriptome.

Cap analysis of gene expression (CAGE) is a gene expression technique used in molecular biology to produce a snapshot of the 5′ end of the messenger RNA population in a biological sample. The small fragments from the very beginnings of mRNAs are extracted, reverse-transcribed to cDNA, PCR amplified and sequenced. CAGE was first published by Hayashizaki, Carninci and co-workers in 2003. CAGE has been extensively used within the FANTOM research projects.

Massive parallel signature sequencing (MPSS) is a procedure that is used to identify and quantify mRNA transcripts, resulting in data similar to serial analysis of gene expression (SAGE), although it employs a series of biochemical and sequencing steps that are substantially different.

Paired-end tags (PET) are the short sequences at the 5’ and 3' ends of a DNA fragment which are unique enough that they (theoretically) exist together only once in a genome, therefore making the sequence of the DNA in between them available upon search or upon further sequencing. Paired-end tags (PET) exist in PET libraries with the intervening DNA absent, that is, a PET "represents" a larger fragment of genomic or cDNA by consisting of a short 5' linker sequence, a short 5' sequence tag, a short 3' sequence tag, and a short 3' linker sequence. It was shown conceptually that 13 base pairs are sufficient to map tags uniquely. However, longer sequences are more practical for mapping reads uniquely. The endonucleases used to produce PETs give longer tags but sequences of 50–100 base pairs would be optimal for both mapping and cost efficiency. After extracting the PETs from many DNA fragments, they are linked (concatenated) together for efficient sequencing. On average, 20–30 tags could be sequenced with the Sanger method, which has a longer read length. Since the tag sequences are short, individual PETs are well suited for next-generation sequencing that has short read lengths and higher throughput. The main advantages of PET sequencing are its reduced cost by sequencing only short fragments, detection of structural variants in the genome, and increased specificity when aligning back to the genome compared to single tags, which involves only one end of the DNA fragment.

MicroRNA sequencing (miRNA-seq), a type of RNA-Seq, is the use of next-generation sequencing or massively parallel high-throughput DNA sequencing to sequence microRNAs, also called miRNAs. miRNA-seq differs from other forms of RNA-seq in that input material is often enriched for small RNAs. miRNA-seq allows researchers to examine tissue-specific expression patterns, disease associations, and isoforms of miRNAs, and to discover previously uncharacterized miRNAs. Evidence that dysregulated miRNAs play a role in diseases such as cancer has positioned miRNA-seq to potentially become an important tool in the future for diagnostics and prognostics as costs continue to decrease. Like other miRNA profiling technologies, miRNA-Seq has both advantages and disadvantages.

Single-cell sequencing examines the nucleic acid sequence information from individual cells with optimized next-generation sequencing technologies, providing a higher resolution of cellular differences and a better understanding of the function of an individual cell in the context of its microenvironment. For example, in cancer, sequencing the DNA of individual cells can give information about mutations carried by small populations of cells. In development, sequencing the RNAs expressed by individual cells can give insight into the existence and behavior of different cell types. In microbial systems, a population of the same species can appear genetically clonal. Still, single-cell sequencing of RNA or epigenetic modifications can reveal cell-to-cell variability that may help populations rapidly adapt to survive in changing environments.

<span class="mw-page-title-main">Transcriptome in vivo analysis tag</span>

A transcriptome in vivo analysis tag is a multifunctional, photoactivatable mRNA-capture molecule designed for isolating mRNA from a single cell in complex tissues.

The Cancer Genome Anatomy Project (CGAP), created by the National Cancer Institute (NCI) in 1997 and introduced by Al Gore, is an online database on normal, pre-cancerous and cancerous genomes. It also provides tools for viewing and analysis of the data, allowing for identification of genes involved in various aspects of tumor progression. The goal of CGAP is to characterize cancer at a molecular level by providing a platform with readily accessible updated data and a set of tools such that researchers can easily relate their findings to existing knowledge. There is also a focus on development of software tools that improve the usage of large and complex datasets. The project is directed by Daniela S. Gerhard, and includes sub-projects or initiatives, with notable ones including the Cancer Chromosome Aberration Project (CCAP) and the Genetic Annotation Initiative (GAI). CGAP contributes to many databases and organisations such as the NCBI contribute to CGAP's databases.

Template-switching polymerase chain reaction (TS-PCR) is a method of reverse transcription and polymerase chain reaction (PCR) amplification that relies on a natural PCR primer sequence at the polyadenylation site, also known as the poly(A) tail, and adds a second primer through the activity of murine leukemia virus reverse transcriptase. This permits reading full cDNA sequences and can deliver high yield from single sources, even single cells that contain 10 to 30 picograms of mRNA, with relatively low levels (3-5%) of contaminating rRNA sequence. This technique is often employed in whole transcriptome shotgun sequencing. It is marketed by Clontech as Switching Mechanism At the 5' end of RNA Template (SMART) as well as by Diagenode as Capture and Amplification by Tailing and Switching (CATS).

<span class="mw-page-title-main">Epitranscriptomic sequencing</span>

In epitranscriptomic sequencing, most methods focus on either (1) enrichment and purification of the modified RNA molecules before running on the RNA sequencer, or (2) improving or modifying bioinformatics analysis pipelines to call the modification peaks. Most methods have been adapted and optimized for mRNA molecules, except for modified bisulfite sequencing for profiling 5-methylcytidine which was optimized for tRNAs and rRNAs.

Transcriptomics technologies are the techniques used to study an organism's transcriptome, the sum of all of its RNA transcripts. The information content of an organism is recorded in the DNA of its genome and expressed through transcription. Here, mRNA serves as a transient intermediary molecule in the information network, whilst non-coding RNAs perform additional diverse functions. A transcriptome captures a snapshot in time of the total transcripts present in a cell. Transcriptomics technologies provide a broad account of which cellular processes are active and which are dormant. A major challenge in molecular biology is to understand how a single genome gives rise to a variety of cells. Another is how gene expression is regulated.

<span class="mw-page-title-main">Spatial transcriptomics</span> Range of methods designed for assigning cell types

Spatial transcriptomics is a method for assigning cell types to their locations in the histological sections. This method can also be used to determine subcellular localization of mRNA molecules. The term is a variation of Spatial Genomics, first described by Doyle, et al., in 2000 and then expanded upon by Ståhl et al. in a technique developed in 2016, which has since undergone a variety of improvements and modifications.

References

  1. Shafee, Thomas; Lowe, Rohan (2017). "Eukaryotic and prokaryotic gene structure". WikiJournal of Medicine. 4 (1). doi: 10.15347/wjm/2017.002 . ISSN   2002-4436.
  2. Saha S, et al. (2002). "Using the transcriptome to annotate the genome". Nat Biotechnol. 20 (5): 508–12. doi:10.1038/nbt0502-508. PMID   11981567. S2CID   12709815.
  3. Gowda M; Jantasuriyarat C; Dean RA; Wang GL. (2004). "Robust-LongSAGE (RL-SAGE): a substantially improved LongSAGE method for gene discovery and transcriptome analysis". Plant Physiol. 134 (3): 890–7. doi:10.1104/pp.103.034496. PMC   389912 . PMID   15020752.
  4. Matsumura H; Ito A; Saitoh H; Winter P; Kahl G; Reuter M; Krüger DH; Terauchi R. (2005). "SuperSAGE". Cell Microbiol. 7 (1): 11–8. doi: 10.1111/j.1462-5822.2004.00478.x . PMID   15617519. S2CID   221579149.
  5. Sim GK; Kafatos FC; Jones CW; Koehler MD; Efstratiadis A; Maniatis T (December 1979). "Use of a cDNA library for studies on evolution and developmental expression of the chorion multigene families". Cell. 18 (4): 1303–16. doi: 10.1016/0092-8674(79)90241-1 . PMID   519770.
  6. Sutcliffe JG; Milner RJ; Bloom FE; Lerner RA (August 1982). "Common 82-nucleotide sequence unique to brain RNA". Proc Natl Acad Sci U S A. 79 (16): 4942–6. Bibcode:1982PNAS...79.4942S. doi: 10.1073/pnas.79.16.4942 . PMC   346801 . PMID   6956902.
  7. Putney SD; Herlihy WC; Schimmel P (1983). "A new troponin T and cDNA clones for 13 different muscle proteins, found by shotgun sequencing". Nature. 302 (5910): 718–21. Bibcode:1983Natur.302..718P. doi:10.1038/302718a0. PMID   6687628. S2CID   4364361.
  8. Adams MD, Kelley JM, Gocayne JD, et al. (June 1991). "Complementary DNA sequencing: expressed sequence tags and human genome project". Science. 252 (5013): 1651–6. Bibcode:1991Sci...252.1651A. doi:10.1126/science.2047873. PMID   2047873. S2CID   13436211.
  9. 1 2 Velculescu VE; Zhang L; Vogelstein B; Kinzler KW. (1995). "Serial analysis of gene expression". Science. 270 (5235): 484–7. Bibcode:1995Sci...270..484V. doi:10.1126/science.270.5235.484. PMID   7570003. S2CID   16281846.
  10. 1 2 Saha, S., et al. (2002). "Using the transcriptome to annotate the genome." Nat Biotechnol 20(5): 508-512.
  11. Gowda, M., et al. (2004). "Robust-LongSAGE (RL-SAGE): a substantially improved LongSAGE method for gene discovery and transcriptome analysis." Plant Physiol 134(3): 890-897.
  12. Matsumura, H.; Reich, S.; Ito, A.; Saitoh, H.; Kamoun, S.; Winter, P.; Kahl, G.; Reuter, M.; Krüger, D.; Terauchi, R. (2003). "Gene expression analysis of plant host-pathogen interactions by SuperSAGE". Proceedings of the National Academy of Sciences. 100 (26): 15718–15723. Bibcode:2003PNAS..10015718M. doi: 10.1073/pnas.2536670100 . PMC   307634 . PMID   14676315.
  13. Gowda, Malali; Jantasuriyarat, Chatchawan; Dean, Ralph A.; Wang, Guo-Liang (2004-03-01). "Robust-LongSAGE (RL-SAGE): A Substantially Improved LongSAGE Method for Gene Discovery and Transcriptome Analysis". Plant Physiology. 134 (3): 890–897. doi:10.1104/pp.103.034496. ISSN   1532-2548. PMC   389912 . PMID   15020752.
  14. Shendure, J. (2008). "The beginning of the end for microarrays?". Nature Methods. 5 (7): 585–7. doi:10.1038/nmeth0708-585. PMID   18587314. S2CID   29682662.
  15. Matsumura, H.; Bin Nasir, K. H.; Yoshida, K.; Ito, A.; Kahl, G. N.; Krüger, D. H.; Terauchi, R. (2006). "SuperSAGE array: the direct use of 26-base-pair transcript tags in oligonucleotide arrays". Nature Methods. 3 (6): 469–74. doi:10.1038/nmeth882. PMID   16721381. S2CID   19160070.
  16. Zawada, Adam (January 2014). "Massive analysis of cDNA Ends (MACE) and miRNA expression profiling identifies proatherogenic pathways in chronic kidney disease". Epigenetics. 9 (1): 161–172. doi:10.4161/epi.26931. PMC   3928179 . PMID   24184689.