Seven management and planning tools

Last updated

The seven management and planning tools have their roots in operations research work done after World War II and the Japanese total quality control (TQC) research. [1] [2]

Contents

The New seven tools

Affinity diagram [KJ method]

Affinity diagram AffinitySmall.gif
Affinity diagram

Affinity diagrams are a special kind of brainstorming tool that organize large amount of disorganized data and information into groupings based on natural relationships.

It was created in the 1960s by the Japanese anthropologist Jiro Kawakita. It is also known as KJ diagram, after Jiro Kawakita. An affinity diagram is used when:

  1. You are confronted with many facts or ideas in apparent chaos.
  2. Issues seem too large and complex to grasp.

Interrelationship diagram

Interrelationship digraph InterrelationshipSmall.gif
Interrelationship digraph

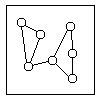
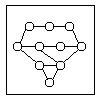
Interrelationship diagrams (IDs) displays all the interrelated cause-and-effect relationships and factors involved in a complex problem and describes desired outcomes. The process of creating an interrelationship diagram helps a group analyze the natural links between different aspects of a complex situation.

Tree diagram

Tree diagram TreeDiagramSmall.gif
Tree diagram

This tool is used to break down broad categories into finer and finer levels of detail. It can map levels of details of tasks that are required to accomplish a goal or solution or task. Developing a tree diagram directs concentration from generalities to specifics.

Prioritization matrix

Matrix diagram MatrixSmall.gif
Matrix diagram

This tool is used to prioritize items and describe them in terms of weighted criteria. It uses a combination of tree and matrix diagramming techniques to do a pair-wise evaluation of items and to narrow down options to the most desired or most effective. Popular applications for the prioritization matrix include return on investment (ROI) or cost–benefit analysis (investment vs. return), time management matrix (urgency vs. importance), etc.

Matrix diagram or quality table

Matrix diagram MatrixSmall.gif
Matrix diagram

This tool shows the relationship between two or more sets of elements. At each intersection, a relationship is either absent or present. It then gives information about the relationship, such as its strength, the roles played by various individuals or measurements. The matrix diagram enables you to analyze relatively complex situations by exposing interactions and dependencies between things. Six differently shaped matrices are possible: L, T, Y, X, C, R and roof-shaped, depending on how many groups must be compared.

Process decision program chart

Process decision program chart ProcessDecisionSmall.gif
Process decision program chart

A useful way of planning is to break down tasks into a hierarchy, using a tree diagram. The process decision program chart (PDPC) extends the tree diagram a couple of levels to identify risks and countermeasures for the bottom level tasks. Different shaped boxes are used to highlight risks and identify possible countermeasures (often shown as "clouds" to indicate their uncertain nature). The PDPC is similar to the failure modes and effects analysis (FMEA) in that both identify risks, consequences of failure, and contingency actions; the FMEA also rates relative risk levels for each potential failure point.

Activity network diagram

Arrow diagram ActivityNetworkSmall.gif
Arrow diagram

This tool is used to plan the appropriate sequence or schedule for a set of tasks and related subtasks. It is used when subtasks must occur in parallel. The diagram helps in determining the critical path (longest sequence of tasks). The purpose is to help people sequentially define, organize, and manage a complex set of activities.

See also

Related Research Articles

<span class="mw-page-title-main">Systems engineering</span> Interdisciplinary field of engineering

Systems engineering is an interdisciplinary field of engineering and engineering management that focuses on how to design, integrate, and manage complex systems over their life cycles. At its core, systems engineering utilizes systems thinking principles to organize this body of knowledge. The individual outcome of such efforts, an engineered system, can be defined as a combination of components that work in synergy to collectively perform a useful function.

<span class="mw-page-title-main">Safety engineering</span> Engineering discipline which assures that engineered systems provide acceptable levels of safety

Safety engineering is an engineering discipline which assures that engineered systems provide acceptable levels of safety. It is strongly related to industrial engineering/systems engineering, and the subset system safety engineering. Safety engineering assures that a life-critical system behaves as needed, even when components fail.

<span class="mw-page-title-main">Ishikawa diagram</span> Causal diagrams created by Kaoru Ishikawa

Ishikawa diagrams are causal diagrams created by Kaoru Ishikawa that show the potential causes of a specific event.

<span class="mw-page-title-main">Fault tree analysis</span> Failure analysis system used in safety engineering and reliability engineering

Fault tree analysis (FTA) is a type of failure analysis in which an undesired state of a system is examined. This analysis method is mainly used in safety engineering and reliability engineering to understand how systems can fail, to identify the best ways to reduce risk and to determine event rates of a safety accident or a particular system level (functional) failure. FTA is used in the aerospace, nuclear power, chemical and process, pharmaceutical, petrochemical and other high-hazard industries; but is also used in fields as diverse as risk factor identification relating to social service system failure. FTA is also used in software engineering for debugging purposes and is closely related to cause-elimination technique used to detect bugs.

Project management software (PMS) can help plan, organize, and manage resource tools and develop resource estimates. Depending on the sophistication of the software, it can manage estimation and planning, scheduling, cost control and budget management, resource allocation, collaboration software, communication, decision-making, quality management, time management and documentation or administration systems. Numerous PC and browser-based project management software and contract management software products and services are available.

<span class="mw-page-title-main">Scatter plot</span> Plot using the dispersal of scattered dots to show the relationship between variables

A scatter plot, also called a scatterplot, scatter graph, scatter chart, scattergram, or scatter diagram, is a type of plot or mathematical diagram using Cartesian coordinates to display values for typically two variables for a set of data. If the points are coded (color/shape/size), one additional variable can be displayed. The data are displayed as a collection of points, each having the value of one variable determining the position on the horizontal axis and the value of the other variable determining the position on the vertical axis.

Failure mode and effects analysis is the process of reviewing as many components, assemblies, and subsystems as possible to identify potential failure modes in a system and their causes and effects. For each component, the failure modes and their resulting effects on the rest of the system are recorded in a specific FMEA worksheet. There are numerous variations of such worksheets. An FMEA can be a qualitative analysis, but may be put on a quantitative basis when mathematical failure rate models are combined with a statistical failure mode ratio database. It was one of the first highly structured, systematic techniques for failure analysis. It was developed by reliability engineers in the late 1950s to study problems that might arise from malfunctions of military systems. An FMEA is often the first step of a system reliability study.

Reliability engineering is a sub-discipline of systems engineering that emphasizes the ability of equipment to function without failure. Reliability describes the ability of a system or component to function under stated conditions for a specified period of time. Reliability is closely related to availability, which is typically described as the ability of a component or system to function at a specified moment or interval of time.

<span class="mw-page-title-main">Task management</span> Process of managing a task through its life cycle

Task management is the process of overseeing a task through its lifecycle. It involves planning, testing, tracking, and reporting. Task management can help individuals achieve goals or enable groups of individuals to collaborate and share knowledge for the accomplishment of collective goals. Tasks are also differentiated by complexity, from low to high.

DMAIC or define, measure, analyze, improve and control refers to a data-driven improvement cycle used for optimizing and stabilizing business processes and designs. The DMAIC improvement cycle is the core tool used to drive Six Sigma projects. However, DMAIC is not exclusive to Six Sigma and can be used as the framework for other improvement applications.

Failure mode effects and criticality analysis (FMECA) is an extension of failure mode and effects analysis (FMEA).

Threat modeling is a process by which potential threats, such as structural vulnerabilities or the absence of appropriate safeguards, can be identified and enumerated, and countermeasures prioritized. The purpose of threat modeling is to provide defenders with a systematic analysis of what controls or defenses need to be included, given the nature of the system, the probable attacker's profile, the most likely attack vectors, and the assets most desired by an attacker. Threat modeling answers questions like "Where am I most vulnerable to attack?", "What are the most relevant threats?", and "What do I need to do to safeguard against these threats?".

Risk-based inspection (RBI) is an optimal maintenance business process used to examine equipment such as pressure vessels, quick-opening closure - doors, heat exchangers, and piping in industrial plants. RBI is a decision-making methodology for optimizing inspection plans. The RBI concept lies in that the risk of failure can be assessed in relation to a level that is acceptable, and inspection and repair used to ensure that the level of risk is below that acceptance limit. It examines the health, safety and environment and business risk of ‘active’ and ‘potential’ damage mechanisms to assess and rank failure probability and consequence. This ranking is used to optimize inspection intervals based on site-acceptable risk levels and operating limits, while mitigating risks as appropriate. RBI analysis can be qualitative, quantitative or semi-quantitative in nature.

Eight Disciplines Methodology (8D) is a method or model developed at Ford Motor Company used to approach and to resolve problems, typically employed by quality engineers or other professionals. Focused on product and process improvement, its purpose is to identify, correct, and eliminate recurring problems. It establishes a permanent corrective action based on statistical analysis of the problem and on the origin of the problem by determining the root causes. Although it originally comprised eight stages, or 'disciplines', it was later augmented by an initial planning stage. 8D follows the logic of the PDCA cycle. The disciplines are:

Requirements traceability is a sub-discipline of requirements management within software development and systems engineering. Traceability as a general term is defined by the IEEE Systems and Software Engineering Vocabulary as (1) the degree to which a relationship can be established between two or more products of the development process, especially products having a predecessor-successor or primary-subordinate relationship to one another; (2) the identification and documentation of derivation paths (upward) and allocation or flowdown paths (downward) of work products in the work product hierarchy; (3) the degree to which each element in a software development product establishes its reason for existing; and (4) discernible association among two or more logical entities, such as requirements, system elements, verifications, or tasks.

Process Decision Program Chart (PDPC) is a technique designed to help prepare contingency plans. The emphasis of the PDPC is to identify the consequential impact of failure on activity plans, and create appropriate contingency plans to limit risks. Process diagrams and planning tree diagrams are extended by a couple of levels when the PDPC is applied to the bottom level tasks on those diagrams.

<span class="mw-page-title-main">Affinity diagram</span>

The affinity diagram is a business tool used to organize ideas and data. It is one of the Seven Management and Planning Tools. People have been grouping data into groups based on natural relationships for thousands of years; however, the term affinity diagram was devised by Jiro Kawakita in the 1960s and is sometimes referred to as the KJ Method.

<span class="mw-page-title-main">Project management triangle</span> Model of the constraints of project management

The project management triangle is a model of the constraints of project management. While its origins are unclear, it has been used since at least the 1950s. It contends that:

  1. The quality of work is constrained by the project's budget, deadlines and scope (features).
  2. The project manager can trade between constraints.
  3. Changes in one constraint necessitate changes in others to compensate or quality will suffer.
SDI Tools

SDI Tools is a set of commercial software add-in tools for Microsoft Excel developed and distributed by Statistical Design Institute, LLC., a privately owned company located in Texas, United States.

Event tree analysis (ETA) is a forward, top-down, logical modeling technique for both success and failure that explores responses through a single initiating event and lays a path for assessing probabilities of the outcomes and overall system analysis. This analysis technique is used to analyze the effects of functioning or failed systems given that an event has occurred.

References

  1. Seven New Quality Tools for Managers and Staff. 1979. translated into English 1983
  2. Seven New Management and Planning Tools