Related Research Articles
The Protein Data Bank (PDB) is a database for the three-dimensional structural data of large biological molecules, such as proteins and nucleic acids. The data, typically obtained by X-ray crystallography, NMR spectroscopy, or, increasingly, cryo-electron microscopy, and submitted by biologists and biochemists from around the world, are freely accessible on the Internet via the websites of its member organisations. The PDB is overseen by an organization called the Worldwide Protein Data Bank, wwPDB.
Molecular dynamics (MD) is a computer simulation method for analyzing the physical movements of atoms and molecules. The atoms and molecules are allowed to interact for a fixed period of time, giving a view of the dynamic "evolution" of the system. In the most common version, the trajectories of atoms and molecules are determined by numerically solving Newton's equations of motion for a system of interacting particles, where forces between the particles and their potential energies are often calculated using interatomic potentials or molecular mechanical force fields. The method is applied mostly in chemical physics, materials science, and biophysics.
GROMACS is a molecular dynamics package mainly designed for simulations of proteins, lipids, and nucleic acids. It was originally developed in the Biophysical Chemistry department of University of Groningen, and is now maintained by contributors in universities and research centers worldwide. GROMACS is one of the fastest and most popular software packages available, and can run on central processing units (CPUs) and graphics processing units (GPUs). It is free, open-source software released under the GNU General Public License (GPL), and starting with version 4.6, the GNU Lesser General Public License (LGPL).
Folding@home is a distributed computing project aimed to help scientists develop new therapeutics for a variety of diseases by the means of simulating protein dynamics. This includes the process of protein folding and the movements of proteins, and is reliant on simulations run on volunteers' personal computers. Folding@home is currently based at the University of Pennsylvania and led by Greg Bowman, a former student of Vijay Pande.

Scientific visualization is an interdisciplinary branch of science concerned with the visualization of scientific phenomena. It is also considered a subset of computer graphics, a branch of computer science. The purpose of scientific visualization is to graphically illustrate scientific data to enable scientists to understand, illustrate, and glean insight from their data. Research into how people read and misread various types of visualizations is helping to determine what types and features of visualizations are most understandable and effective in conveying information.
A kinemage is an interactive graphic scientific illustration. It often is used to visualize molecules, especially proteins although it can also represent other types of 3-dimensional data. The kinemage system is designed to optimize ease of use, interactive performance, and the perception and communication of detailed 3D information. The kinemage information is stored in a text file, human- and machine-readable, that describes the hierarchy of display objects and their properties, and includes optional explanatory text. The kinemage format is a defined chemical MIME type of 'chemical/x-kinemage' with the file extension '.kin'.
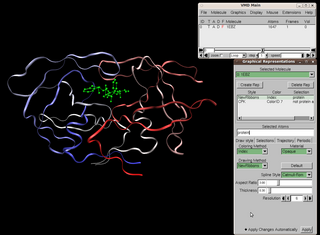
Visual Molecular Dynamics (VMD) is a molecular modelling and visualization computer program. VMD is developed mainly as a tool to view and analyze the results of molecular dynamics simulations. It also includes tools for working with volumetric data, sequence data, and arbitrary graphics objects. Molecular scenes can be exported to external rendering tools such as POV-Ray, RenderMan, Tachyon, Virtual Reality Modeling Language (VRML), and many others. Users can run their own Tcl and Python scripts within VMD as it includes embedded Tcl and Python interpreters. VMD runs on Unix, Apple Mac macOS, and Microsoft Windows. VMD is available to non-commercial users under a distribution-specific license which permits both use of the program and modification of its source code, at no charge.
Molecular modelling encompasses all methods, theoretical and computational, used to model or mimic the behaviour of molecules. The methods are used in the fields of computational chemistry, drug design, computational biology and materials science to study molecular systems ranging from small chemical systems to large biological molecules and material assemblies. The simplest calculations can be performed by hand, but inevitably computers are required to perform molecular modelling of any reasonably sized system. The common feature of molecular modelling methods is the atomistic level description of the molecular systems. This may include treating atoms as the smallest individual unit, or explicitly modelling protons and neutrons with its quarks, anti-quarks and gluons and electrons with its photons.
A chemical file format is a type of data file which is used specifically for depicting molecular data. One of the most widely used is the chemical table file format, which is similar to Structure Data Format (SDF) files. They are text files that represent multiple chemical structure records and associated data fields. The XYZ file format is a simple format that usually gives the number of atoms in the first line, a comment on the second, followed by a number of lines with atomic symbols and cartesian coordinates. The Protein Data Bank Format is commonly used for proteins but is also used for other types of molecules. There are many other types which are detailed below. Various software systems are available to convert from one format to another.
RasMol is a computer program written for molecular graphics visualization intended and used mainly to depict and explore biological macromolecule structures, such as those found in the Protein Data Bank. It was originally developed by Roger Sayle in the early 1990s.
PyMOL is an open source but proprietary molecular visualization system created by Warren Lyford DeLano. It was commercialized initially by DeLano Scientific LLC, which was a private software company dedicated to creating useful tools that become universally accessible to scientific and educational communities. It is currently commercialized by Schrödinger, Inc. As the original software license was a permissive licence, they were able to remove it; new versions are no longer released under the Python license, but under a custom license, and some of the source code is no longer released. PyMOL can produce high-quality 3D images of small molecules and biological macromolecules, such as proteins. According to the original author, by 2009, almost a quarter of all published images of 3D protein structures in the scientific literature were made using PyMOL.
MDL Chime was a free plugin used by web browsers to display the three-dimensional structures of molecules. and was based on the RasMol code.
Jmol is computer software for molecular modelling chemical structures in 3-dimensions. Jmol returns a 3D representation of a molecule that may be used as a teaching tool, or for research e.g., in chemistry and biochemistry. It is written in the programming language Java, so it can run on the operating systems Windows, macOS, Linux, and Unix, if Java is installed. It is free and open-source software released under a GNU Lesser General Public License (LGPL) version 2.0. A standalone application and a software development kit (SDK) exist that can be integrated into other Java applications, such as Bioclipse and Taverna.
The Molecular Modelling Toolkit (MMTK) is an open-source software package written in Python, which performs common tasks in molecular modelling.
The Molecular Modeling Toolkit is a library that implements common molecular simulation techniques, with an emphasis on biomolecular simulations. It uses modern software engineering techniques in order to overcome limitations associated with the large monolithic simulation programs that are commonly used for biomolecules. Its principal advantages are (1) easy extension and combination with other libraries due to modular library design, (2) a single high-level general-purpose programming language (Python) is used for library implementation as well as for application scripts, (3) use of documented and machine-independent formats for all data files, and (4) interfaces to other simulation and visualization programs.

UCSF Chimera is an extensible program for interactive visualization and analysis of molecular structures and related data, including density maps, supramolecular assemblies, sequence alignments, docking results, trajectories, and conformational ensembles. High-quality images and movies can be created. Chimera includes complete documentation and can be downloaded free of charge for noncommercial use.
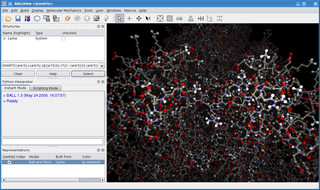
BALL is a C++ class framework and set of algorithms and data structures for molecular modelling and computational structural bioinformatics, a Python interface to this library, and a graphical user interface to BALL, the molecule viewer BALLView.
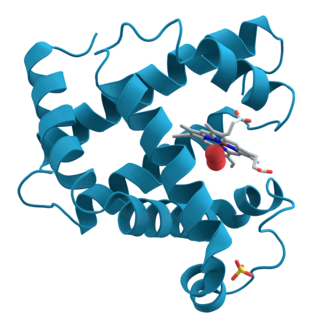
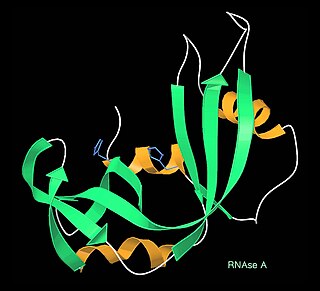
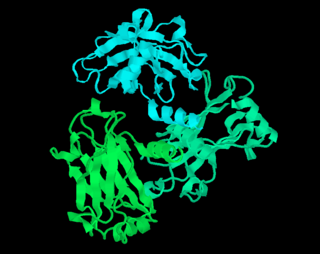
Ribbon diagrams, also known as Richardson diagrams, are 3D schematic representations of protein structure and are one of the most common methods of protein depiction used today. The ribbon depicts the general course and organisation of the protein backbone in 3D and serves as a visual framework for hanging details of the entire atomic structure, such as the balls for the oxygen atoms attached to myoglobin's active site in the adjacent figure. Ribbon diagrams are generated by interpolating a smooth curve through the polypeptide backbone. α-helices are shown as coiled ribbons or thick tubes, β-strands as arrows, and non-repetitive coils or loops as lines or thin tubes. The direction of the polypeptide chain is shown locally by the arrows, and may be indicated overall by a colour ramp along the length of the ribbon.
The Extensible Computational Chemistry Environment provides a sophisticated graphical user interface, scientific visualization tools, and the underlying data management framework enabling scientists to efficiently set up calculations and store, retrieve, and analyze the rapidly growing volumes of data produced by computational chemistry studies.
Molecular Operating Environment (MOE) is a drug discovery software platform that integrates visualization, modeling and simulations, as well as methodology development, in one package. MOE scientific applications are used by biologists, medicinal chemists and computational chemists in pharmaceutical, biotechnology and academic research. MOE runs on Windows, Linux, Unix, and macOS. Main application areas in MOE include structure-based design, fragment-based design, ligand-based design, pharmacophore discovery, medicinal chemistry applications, biologics applications, structural biology and bioinformatics, protein and antibody modeling, molecular modeling and simulations, virtual screening, cheminformatics & QSAR. The Scientific Vector Language (SVL) is the built-in command, scripting and application development language of MOE.
References
- ↑ Molecular Biology Toolkit Archived 2012-12-14 at archive.today
- ↑ Sirius help
- ↑ Sirius downloads