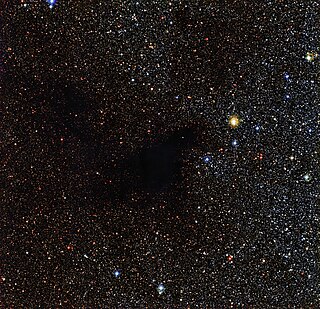
In astronomy, extinction is the absorption and scattering of electromagnetic radiation by dust and gas between an emitting astronomical object and the observer. Interstellar extinction was first documented as such in 1930 by Robert Julius Trumpler. However, its effects had been noted in 1847 by Friedrich Georg Wilhelm von Struve, and its effect on the colors of stars had been observed by a number of individuals who did not connect it with the general presence of galactic dust. For stars lying near the plane of the Milky Way which are within a few thousand parsecs of the Earth, extinction in the visual band of frequencies is roughly 1.8 magnitudes per kiloparsec.

Multispectral imaging captures image data within specific wavelength ranges across the electromagnetic spectrum. The wavelengths may be separated by filters or detected with the use of instruments that are sensitive to particular wavelengths, including light from frequencies beyond the visible light range. It can allow extraction of additional information the human eye fails to capture with its visible receptors for red, green and blue. It was originally developed for military target identification and reconnaissance. Early space-based imaging platforms incorporated multispectral imaging technology to map details of the Earth related to coastal boundaries, vegetation, and landforms. Multispectral imaging has also found use in document and painting analysis.

Red edge refers to the region of rapid change in reflectance of vegetation in the near infrared range of the electromagnetic spectrum. Chlorophyll contained in vegetation absorbs most of the light in the visible part of the spectrum but becomes almost transparent at wavelengths greater than 700 nm. The cellular structure of the vegetation then causes this infrared light to be reflected because each cell acts something like an elementary corner reflector. The change can be from 5% to 50% reflectance going from 680 nm to 730 nm. This is an advantage to plants in avoiding overheating during photosynthesis. For a more detailed explanation and a graph of the photosynthetically active radiation (PAR) spectral region, see Normalized difference vegetation index § Rationale.
Spectral imaging is imaging that uses multiple bands across the electromagnetic spectrum. While an ordinary camera captures light across three wavelength bands in the visible spectrum, red, green, and blue (RGB), spectral imaging encompasses a wide variety of techniques that go beyond RGB. Spectral imaging may use the infrared, the visible spectrum, the ultraviolet, x-rays, or some combination of the above. It may include the acquisition of image data in visible and non-visible bands simultaneously, illumination from outside the visible range, or the use of optical filters to capture a specific spectral range. It is also possible to capture hundreds of wavelength bands for each pixel in an image.

The normalized difference vegetation index (NDVI) is a widely-used metric for quantifying the health and density of vegetation using sensor data. It is calculated from spectrometric data at two specific bands: red and near-infrared. The spectrometric data is usually sourced from remote sensors, such as satellites.
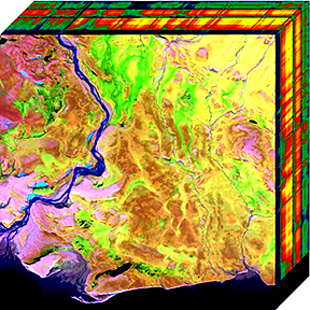
Hyperspectral imaging collects and processes information from across the electromagnetic spectrum. The goal of hyperspectral imaging is to obtain the spectrum for each pixel in the image of a scene, with the purpose of finding objects, identifying materials, or detecting processes. There are three general types of spectral imagers. There are push broom scanners and the related whisk broom scanners, which read images over time, band sequential scanners, which acquire images of an area at different wavelengths, and snapshot hyperspectral imagers, which uses a staring array to generate an image in an instant.
The fraction of absorbed photosynthetically active radiation is the fraction of the incoming solar radiation in the photosynthetically active radiation spectral region that is absorbed by a photosynthetic organism, typically describing the light absorption across an integrated plant canopy.
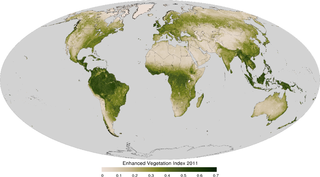
The enhanced vegetation index (EVI) is an 'optimized' vegetation index designed to enhance the vegetation signal with improved sensitivity in high biomass regions and improved vegetation monitoring through a de-coupling of the canopy background signal and a reduction in atmosphere influences. EVI is computed following this equation:
In astronomy, the color index is a simple numerical expression that determines the color of an object, which in the case of a star gives its temperature. The lower the color index, the more blue the object is. Conversely, the larger the color index, the more red the object is. This is a consequence of the logarithmic magnitude scale, in which brighter objects have smaller magnitudes than dimmer ones. For comparison, the whitish Sun has a B−V index of 0.656 ± 0.005, whereas the bluish Rigel has a B−V of −0.03. Traditionally, the color index uses Vega as a zero point. The blue supergiant Theta Muscae has one of the lowest B−V indices at −0.41, while the red giant and carbon star R Leporis has one of the largest, at +5.74.

HR 5171, also known as V766 Centauri, is a yellow hypergiant in the constellation Centaurus. It is said to be either an extreme red supergiant (RSG) or recent post-red supergiant (Post-RSG) yellow hypergiant (YHG), both of which suggest it is one of the largest known stars. The star's diameter is uncertain but likely to be between 1,100 and 1,600 times that of the Sun, while its distance is 3.6 kpc from Earth.
Normalized Difference Water Index (NDWI) may refer to one of at least two remote sensing-derived indexes related to liquid water:
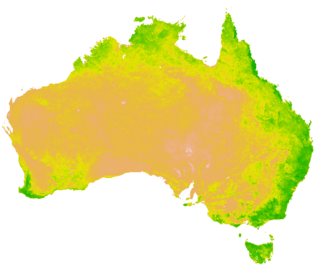
A vegetation index (VI) is a spectral imaging transformation of two or more image bands designed to enhance the contribution of vegetation properties and allow reliable spatial and temporal inter-comparisons of terrestrial photosynthetic activity and canopy structural variations.
The normalized difference red edge index (NDRE) is a metric that can be used to analyse whether images obtained from multi-spectral image sensors contain healthy vegetation or not. It is similar to Normalized Difference Vegetation Index (NDVI) but uses the ratio of Near-Infrared and the edge of Red as follows:

Remote sensing is used in the geological sciences as a data acquisition method complementary to field observation, because it allows mapping of geological characteristics of regions without physical contact with the areas being explored. About one-fourth of the Earth's total surface area is exposed land where information is ready to be extracted from detailed earth observation via remote sensing. Remote sensing is conducted via detection of electromagnetic radiation by sensors. The radiation can be naturally sourced, or produced by machines and reflected off of the Earth surface. The electromagnetic radiation acts as an information carrier for two main variables. First, the intensities of reflectance at different wavelengths are detected, and plotted on a spectral reflectance curve. This spectral fingerprint is governed by the physio-chemical properties of the surface of the target object and therefore helps mineral identification and hence geological mapping, for example by hyperspectral imaging. Second, the two-way travel time of radiation from and back to the sensor can calculate the distance in active remote sensing systems, for example, Interferometric synthetic-aperture radar. This helps geomorphological studies of ground motion, and thus can illuminate deformations associated with landslides, earthquakes, etc.

The moment distance index (MDI) is a shape-based metric or shape index that can be used to analyze spectral reflectance curves and waveform LiDAR, proposed by Dr. Eric Ariel L. Salas and Dr. Geoffrey M. Henebry. In the case of spectral data, the shape of the reflectance curve should unmask fine points of the spectra usually not considered by existing band-specific indices. It has been used to identify spectral regions for chlorophyll and carotenoids, detect greenhouses using WorldView-2, Landsat, and Sentinel-2 satellite data, identify greenhouse crops, compute canopy heights, estimate green vegetation fraction, and optimize Fourier-transform infrared (FTIR) scans for soil spectroscopy.
BAITSSS is biophysical Evapotranspiration (ET) computer model that determines water use, primarily in agriculture landscape, using remote sensing-based information. It was developed and refined by Ramesh Dhungel and the water resources group at University of Idaho's Kimberly Research and Extension Center since 2010. It has been used in different areas in the United States including Southern Idaho, Northern California, northwest Kansas, Texas, and Arizona.

Tasseled cap transformation is a method to transform the spectral information of satellite data into spectral indicators. This index is used especially in the analysis of vegetation.
Land cover maps are tools that provide vital information about the Earth's land use and cover patterns. They aid policy development, urban planning, and forest and agricultural monitoring.

Spectroradiometry is a technique in Earth and planetary remote sensing, which makes use of light behaviour, specifically how light energy is reflected, emitted, and scattered by substances, to explore their properties in the electromagnetic (light) spectrum and identify or differentiate between them. The interaction between light radiation and the surface of a given material determines the manner in which the radiation reflects back to a detector, i.e., a spectroradiometer. Combining the elements of spectroscopy and radiometry, spectroradiometry carries out precise measurements of electromagnetic radiation and associated parameters within different wavelength ranges. This technique forms the basis of multi- and hyperspectral imaging and reflectance spectroscopy, commonly applied across numerous geoscience disciplines, which evaluates the spectral properties exhibited by various materials found on Earth and planetary bodies.
Compton Tucker is an Earth scientist and academic. He is a Senior Earth Scientist in the Laboratory for Hydrospheric and Biospheric Sciences at NASA Goddard Space Flight Center in the Earth Science Division in Greenbelt, Maryland, USA.
