Asia is the largest continent in the world by both land area and population. It covers an area of more than 44 million square kilometers, about 30% of Earth's total land area and 8% of Earth's total surface area. The continent, which has long been home to the majority of the human population, was the site of many of the first civilizations. Its 4.7 billion people constitute roughly 60% of the world's population.

The Kyoto Protocol (Japanese: 京都議定書, Hepburn: Kyōto Giteisho) was an international treaty which extended the 1992 United Nations Framework Convention on Climate Change (UNFCCC) that commits state parties to reduce greenhouse gas emissions, based on the scientific consensus that global warming is occurring and that human-made CO2 emissions are driving it. The Kyoto Protocol was adopted in Kyoto, Japan, on 11 December 1997 and entered into force on 16 February 2005. There were 192 parties (Canada withdrew from the protocol, effective December 2012) to the Protocol in 2020.

Hyundai Motor Company, often referred to as Hyundai Motors, and commonly known as Hyundai, is a South Korean multinational automotive manufacturer headquartered in Seoul, South Korea, which was founded in 1967. Currently, the company owns 33.88 percent of Kia Corporation, and fully owns two marques including its luxury cars subsidiary, Genesis, and their electric vehicle brand Ioniq. The three brands altogether make up the Hyundai Motor Group.

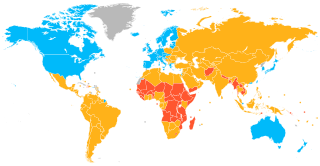
A developed country, or advanced country, is a sovereign state that has a high quality of life, developed economy, and advanced technological infrastructure relative to other less industrialized nations. Most commonly, the criteria for evaluating the degree of economic development are the gross domestic product (GDP), gross national product (GNP), the per capita income, level of industrialization, amount of widespread infrastructure and general standard of living. Which criteria are to be used and which countries can be classified as being developed are subjects of debate. Different definitions of developed countries are provided by the International Monetary Fund and the World Bank; moreover, HDI ranking is used to reflect the composite index of life expectancy, education, and income per capita. In 2023, 40 countries fit all four criteria, while an additional 19 countries fit three out of four.

A middle power is a state that is not a superpower or a great power, but still exerts influence and plays a significant role in international relations. These countries often possess certain capabilities, such as strong economies, advanced technologies, and diplomatic influence, that allow them to have a voice in global affairs. Middle powers are typically seen as bridge-builders between larger powers, using their diplomatic skills to mediate conflicts and promote cooperation on international issues.
An emerging market is a market that has some characteristics of a developed market, but does not fully meet its standards. This includes markets that may become developed markets in the future or were in the past. The term "frontier market" is used for developing countries with smaller, riskier, or more illiquid capital markets than "emerging". As of 2006, the economies of China and India are considered to be the largest emerging markets. According to The Economist, many people find the term outdated, but no new term has gained traction. Emerging market hedge fund capital reached a record new level in the first quarter of 2011 of $121 billion. Emerging market economies’ share of global PPP-adjusted GDP has risen from 27 percent in 1960 to around 53 percent by 2013. The ten largest emerging economies by nominal GDP are 4 of the 9 BRICS countries along with Mexico, South Korea, Indonesia, Turkey, Saudi Arabia, and Poland. The inclusion of South Korea, Poland, and sometimes Taiwan are questionable given they are no longer considered emerging markets by the IMF and World Bank If we ignore those three, the top ten would include Argentina and Thailand.

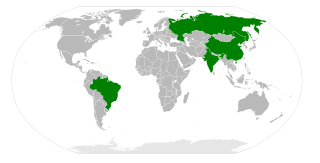
BRIC is a term describing the foreign investment strategies grouping acronym that stands for Brazil, Russia, India, and China. The separate BRICS organisation would go on to become a political and economic organization largely based on such grouping. The grouping has been rendered as "the BRICs", "the BRIC countries", "the BRIC economies", or alternatively as the "Big Four".

This is a timeline of first orbital launches by country. While a number of countries, incl. Canada, Australia, Germany, Brazil, Algeria, Kazakhstan, Turkey, Argentina, Italy, Malaysia, Poland, South Africa, the Philippines, Egypt, Spain, Mexico, Thailand and Chile, have built or launched satellites, as of 2022, eleven countries, incl. the United States, Japan, China, India, Iran, Israel, France, the United Kingdom and South Korea, have had the capability to send objects into orbit with their own launch vehicles. Russia and Ukraine inherited the capability of the space launchers and satellites from the Soviet Union, following its dissolution in 1991. Russia launches its rockets from its own and foreign (Kazakh) spaceports.
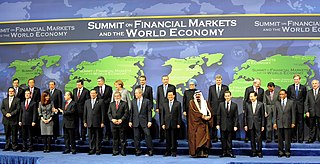
The Global Competitiveness Report (GCR) was a yearly report published by the World Economic Forum. Between 2004 and 2020, the Global Competitiveness Report ranked countries based on the Global Competitiveness Index, developed by Xavier Sala-i-Martin and Elsa V. Artadi. Before that, the macroeconomic ranks were based on Jeffrey Sachs's Growth Development Index and the microeconomic ranks were based on Michael Porter's Business Competitiveness Index. The Global Competitiveness Index integrates the macroeconomic and the micro/business aspects of competitiveness into a single index.

Tourism is a growing sector and key to the economy of several regions of Brazil. The country had 6.589 million visitors in 2018, ranking in terms of the international tourist arrivals as the second main destination in South America after Argentina and third in Latin America after Mexico and Argentina. Revenues from international tourists reached US$5.8 billion in 2015, continuing a recovery trend from the 2008–2009 economic crisis.

The Travel and Tourism Competitiveness Report was first published in 2007 by the World Economic Forum (WEF). The index measures the attractiveness of a country as a place to develop business in the travel and tourism industry, rather than a country's attractiveness as a tourist destination. The report ranks countries according to the Travel and Tourism Competitiveness Index (TTCI). The TTCI scores from 1 to 6 the performance of a given country in each specific subindex. The overall index is made of three main subindexes: (1) regulatory framework; (2) business environment and infrastructure; and (3) human, cultural, and natural resources. The report also includes country profiles with key indicators from the World Bank, the World Tourism Organization and the World Travel and Tourism Council. From the 2021 report, WEF publishes the Travel and Tourism Development Index (TTDI) as an evolution of the TTCI.
Viacom International Inc. is the international division of the Paramount Media Networks subsidiary of Paramount Global that oversees the production, broadcasting and promotion of its brands outside of the United States. These brands include Paramount Network, Comedy Central, MTV, Nickelodeon and BET, as well as CBS-branded channels co-owned with AMC Networks International. PIN also owned a 30% stake in the Rainbow S.p.A. animation studio in Italy from 2011 to 2023 and a stake in Viacom18, an Indian joint venture with domestic partner TV18, from 2007 to 2024.
The FTSE Global Equity Index Series is a series of stock market indices provided by FTSE Group. It was launched in September 2003, and provides coverage of over 17,000 stocks in 48 countries, covering 98% of the world's investable market capitalization.

The OECD Development Centre was established in 1961 as an independent platform for knowledge sharing and policy dialogue between Organisation for Economic Co-operation and Development (OECD) member countries and developing economies, allowing these countries to interact on an equal footing.
The IBSA Goalball World Championships is an international goalball tournament held every four years, since 1978, between Paralympic Games goalball tournaments. It is organised by the International Blind Sports Federation (IBSA) Goalball Subcommittee.

The article contains the number of cases of coronavirus disease 2019 (COVID-19) reported by each country, territory, and subnational area to the World Health Organization (WHO) and published in WHO reports, tables, and spreadsheets. As of 17 November 2024, 776,798,109 cases have been stated by government agencies from around the world to be confirmed. Of the 248 recognized countries and territories around the world, 229 have reported cases of COVID-19. For more international statistics in table and map form, see COVID-19 pandemic by country and territory.
The Committee on Earth Observation Satellites (CEOS) is an international organization created in 1984 around the topic of Earth observation satellites.
 United States 91.43
 Europe 48.07
 Russia 34.06
 China 17.88
 India 17.52
 Canada 16.94
 Japan 14.46
 South Korea 8.89
 Israel 8.38
 Brazil 4.96


