In information theory, the entropy of a random variable quantifies the average level of uncertainty or information associated with the variable's potential states or possible outcomes. This measures the expected amount of information needed to describe the state of the variable, considering the distribution of probabilities across all potential states. Given a discrete random variable , which takes values in the set and is distributed according to , the entropy is where denotes the sum over the variable's possible values. The choice of base for , the logarithm, varies for different applications. Base 2 gives the unit of bits, while base e gives "natural units" nat, and base 10 gives units of "dits", "bans", or "hartleys". An equivalent definition of entropy is the expected value of the self-information of a variable.
Species diversity is the number of different species that are represented in a given community. The effective number of species refers to the number of equally abundant species needed to obtain the same mean proportional species abundance as that observed in the dataset of interest. Meanings of species diversity may include species richness, taxonomic or phylogenetic diversity, and/or species evenness. Species richness is a simple count of species. Taxonomic or phylogenetic diversity is the genetic relationship between different groups of species. Species evenness quantifies how equal the abundances of the species are.

The unified neutral theory of biodiversity and biogeography is a theory and the title of a monograph by ecologist Stephen P. Hubbell. It aims to explain the diversity and relative abundance of species in ecological communities. Like other neutral theories of ecology, Hubbell assumes that the differences between members of an ecological community of trophically similar species are "neutral", or irrelevant to their success. This implies that niche differences do not influence abundance and the abundance of each species follows a random walk. The theory has sparked controversy, and some authors consider it a more complex version of other null models that fit the data better.
In physical organic chemistry, a kinetic isotope effect (KIE) is the change in the reaction rate of a chemical reaction when one of the atoms in the reactants is replaced by one of its isotopes. Formally, it is the ratio of rate constants for the reactions involving the light (kL) and the heavy (kH) isotopically substituted reactants (isotopologues): KIE = kL/kH.

Species richness is the number of different species represented in an ecological community, landscape or region. Species richness is simply a count of species, and it does not take into account the abundances of the species or their relative abundance distributions. Species richness is sometimes considered synonymous with species diversity, but the formal metric species diversity takes into account both species richness and species evenness. Species richness has proven to be a positive representation to show how species interaction in ecosystems can lead to the productivity and growth of biodiversity.

Molecular ecology is a subdiscipline of ecology that is concerned with applying molecular genetic techniques to ecological questions. It is virtually synonymous with the field of "Ecological Genetics" as pioneered by Theodosius Dobzhansky, E. B. Ford, Godfrey M. Hewitt, and others. Molecular ecology is related to the fields of population genetics and conservation genetics.

The intermediate disturbance hypothesis (IDH) suggests that local species diversity is maximized when ecological disturbance is neither too rare nor too frequent. At low levels of disturbance, more competitive organisms will push subordinate species to extinction and dominate the ecosystem. At high levels of disturbance, due to frequent forest fires or human impacts like deforestation, all species are at risk of going extinct. According to IDH theory, at intermediate levels of disturbance, diversity is thus maximized because species that thrive at both early and late successional stages can coexist. IDH is a nonequilibrium model used to describe the relationship between disturbance and species diversity. IDH is based on the following premises: First, ecological disturbances have major effects on species richness within the area of disturbance. Second, interspecific competition results in one species driving a competitor to extinction and becoming dominant in the ecosystem. Third, moderate ecological scale disturbances prevent interspecific competition.
A diversity index is a method of measuring how many different types there are in a dataset. Some more sophisticated indices also account for the phylogenetic relatedness among the types. Diversity indices are statistical representations of different aspects of biodiversity, which are useful simplifications for comparing different communities or sites.
In ecology, alpha diversity (α-diversity) is the mean species diversity in a site at a local scale. The term was introduced by R. H. Whittaker together with the terms beta diversity (β-diversity) and gamma diversity (γ-diversity). Whittaker's idea was that the total species diversity in a landscape is determined by two different things, the mean species diversity in sites at a more local scale and the differentiation among those sites.
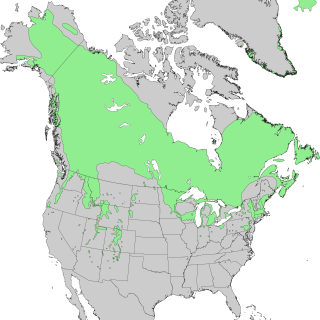
Species distribution, or speciesdispersion, is the manner in which a biological taxon is spatially arranged. The geographic limits of a particular taxon's distribution is its range, often represented as shaded areas on a map. Patterns of distribution change depending on the scale at which they are viewed, from the arrangement of individuals within a small family unit, to patterns within a population, or the distribution of the entire species as a whole (range). Species distribution is not to be confused with dispersal, which is the movement of individuals away from their region of origin or from a population center of high density.

A rank abundance curve or Whittaker plot is a chart used by ecologists to display relative species abundance, a component of biodiversity. It can also be used to visualize species richness and species evenness. It overcomes the shortcomings of biodiversity indices that cannot display the relative role different variables played in their calculation.
In ecology, gamma diversity (γ-diversity) is the total species diversity in a landscape. The term was introduced by R. H. Whittaker together with the terms alpha diversity (α-diversity) and beta diversity (β-diversity). Whittaker's idea was that the total species diversity in a landscape (γ) is determined by two different things, the mean species diversity in sites at a more local scale (α) and the differentiation among those sites (β). According to this reasoning, alpha diversity and beta diversity constitute independent components of gamma diversity:
An index of qualitative variation (IQV) is a measure of statistical dispersion in nominal distributions. Examples include the variation ratio or the information entropy.
Pedodiversity is the variation of soil properties within an area. Pedodiversity studies were first started by analyzing soil series–area relationships. According to Guo et al. (2003) the term pedodiversity was developed by McBratney (1992) who discussed landscape preservation strategies based on pedodiversity. Recently, examinations of pedodiversity using indices commonly used to characterize bio-diversity have been made. Ibáñez et al. (1995) first introduced ecological diversity indices as measures of pedodiversity. They include species richness, relative species abundance, and Shannon index. Richness is the number of different soil types, which is the number of soil classes at particular level in a taxonomic system. Abundance is defined as the distribution of the number of soil individuals.
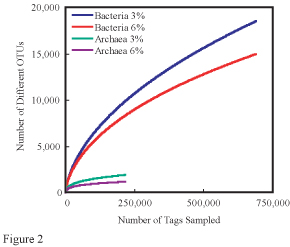
In ecology, rarefaction is a technique to assess species richness from the results of sampling. Rarefaction allows the calculation of species richness for a given number of individual samples, based on the construction of so-called rarefaction curves. This curve is a plot of the number of species as a function of the number of samples. Rarefaction curves generally grow rapidly at first, as the most common species are found, but the curves plateau as only the rarest species remain to be sampled.
Mechanistic models for niche apportionment are biological models used to explain relative species abundance distributions. These niche apportionment models describe how species break up resource pool in multi-dimensional space, determining the distribution of abundances of individuals among species. The relative abundances of species are usually expressed as a Whittaker plot, or rank abundance plot, where species are ranked by number of individuals on the x-axis, plotted against the log relative abundance of each species on the y-axis. The relative abundance can be measured as the relative number of individuals within species or the relative biomass of individuals within species.
Relative species abundance is a component of biodiversity and is a measure of how common or rare a species is relative to other species in a defined location or community. Relative abundance is the percent composition of an organism of a particular kind relative to the total number of organisms in the area. Relative species abundances tend to conform to specific patterns that are among the best-known and most-studied patterns in macroecology. Different populations in a community exist in relative proportions; this idea is known as relative abundance.
A variety of objective means exist to empirically measure biodiversity. Each measure relates to a particular use of the data, and is likely to be associated with the variety of genes. Biodiversity is commonly measured in terms of taxonomic richness of a geographic area over a time interval. In order to calculate biodiversity, species evenness, species richness, and species diversity are to be obtained first. Species evenness is the relative number of individuals of each species in a given area. Species richness is the number of species present in a given area. Species diversity is the relationship between species evenness and species richness. There are many ways to measure biodiversity within a given ecosystem. However, the two most popular are Shannon-Weaver diversity index, commonly referred to as Shannon diversity index, and the other is Simpsons diversity index. Although many scientists prefer to use Shannon's diversity index simply because it takes into account species richness.

Macroinvertebrate Community Index (MCI) is an index used in New Zealand to measure the water quality of fresh water streams. The presence or lack of macroinvertebrates such as insects, worms and snails in a river or stream can give a biological indicator on the health of that waterway. The MCI assigns a number to each species of macroinvertebrate based on the sensitivity of that species to pollution. The index then calculates an average score. A higher score on the MCI generally indicates a more healthy stream.
The Hilsenhoff Biotic Index (HBI) is a quantitative method of evaluating the abundance of arthropod fauna in stream ecosystems as a measurement of estimating water quality based on the predetermined pollution tolerances of the observed taxa. This biotic index was created by William Hilsenhoff in 1977 to measure the effects of oxygen depletion in Wisconsin streams resulting from organic or nutrient pollution.
