Species diversity is the number of different species that are represented in a given community. The effective number of species refers to the number of equally abundant species needed to obtain the same mean proportional species abundance as that observed in the dataset of interest. Meanings of species diversity may include species richness, taxonomic or phylogenetic diversity, and/or species evenness. Species richness is a simple count of species. Taxonomic or phylogenetic diversity is the genetic relationship between different groups of species. Species evenness quantifies how equal the abundances of the species are.

Habitat fragmentation describes the emergence of discontinuities (fragmentation) in an organism's preferred environment (habitat), causing population fragmentation and ecosystem decay. Causes of habitat fragmentation include geological processes that slowly alter the layout of the physical environment, and human activity such as land conversion, which can alter the environment much faster and causes the extinction of many species. More specifically, habitat fragmentation is a process by which large and contiguous habitats get divided into smaller, isolated patches of habitats.
Insular biogeography or island biogeography is a field within biogeography that examines the factors that affect the species richness and diversification of isolated natural communities. The theory was originally developed to explain the pattern of the species–area relationship occurring in oceanic islands. Under either name it is now used in reference to any ecosystem that is isolated due to being surrounded by unlike ecosystems, and has been extended to mountain peaks, seamounts, oasis, fragmented forests, and even natural habitats isolated by human land development. The field was started in the 1960s by the ecologists Robert H. MacArthur and E. O. Wilson, who coined the term island biogeography in their inaugural contribution to Princeton's Monograph in Population Biology series, which attempted to predict the number of species that would exist on a newly created island.
In ecology, the species discovery curve is a graph recording the cumulative number of species of living things recorded in a particular environment as a function of the cumulative effort expended searching for them. It is related to, but not identical with, the species-area curve.
Spatial ecology studies the ultimate distributional or spatial unit occupied by a species. In a particular habitat shared by several species, each of the species is usually confined to its own microhabitat or spatial niche because two species in the same general territory cannot usually occupy the same ecological niche for any significant length of time.
The species–area relationship or species–area curve describes the relationship between the area of a habitat, or of part of a habitat, and the number of species found within that area. Larger areas tend to contain larger numbers of species, and empirically, the relative numbers seem to follow systematic mathematical relationships. The species–area relationship is usually constructed for a single type of organism, such as all vascular plants or all species of a specific trophic level within a particular site. It is rarely if ever, constructed for all types of organisms if simply because of the prodigious data requirements. It is related but not identical to the species discovery curve.
A diversity index is a method of measuring how many different types there are in a dataset. Some more sophisticated indices also account for the phylogenetic relatedness among the types. Diversity indices are statistical representations of different aspects of biodiversity, which are useful simplifications for comparing different communities or sites.
In ecology, alpha diversity (α-diversity) is the mean species diversity in a site at a local scale. The term was introduced by R. H. Whittaker together with the terms beta diversity (β-diversity) and gamma diversity (γ-diversity). Whittaker's idea was that the total species diversity in a landscape is determined by two different things, the mean species diversity in sites at a more local scale and the differentiation among those sites.

Species richness, or biodiversity, increases from the poles to the tropics for a wide variety of terrestrial and marine organisms, often referred to as the latitudinal diversity gradient. The latitudinal diversity gradient is one of the most widely recognized patterns in ecology. It has been observed to varying degrees in Earth's past. A parallel trend has been found with elevation, though this is less well-studied.
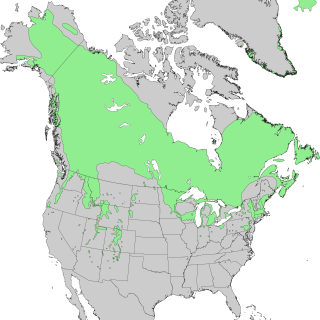
Species distribution, or speciesdispersion, is the manner in which a biological taxon is spatially arranged. The geographic limits of a particular taxon's distribution is its range, often represented as shaded areas on a map. Patterns of distribution change depending on the scale at which they are viewed, from the arrangement of individuals within a small family unit, to patterns within a population, or the distribution of the entire species as a whole (range). Species distribution is not to be confused with dispersal, which is the movement of individuals away from their region of origin or from a population center of high density.
In ecology, beta diversity is the ratio between regional and local species diversity. The term was introduced by R. H. Whittaker together with the terms alpha diversity (α-diversity) and gamma diversity (γ-diversity). The idea was that the total species diversity in a landscape (γ) is determined by two different things: the mean species diversity at the local level (α) and the differentiation among local sites (β). Other formulations for beta diversity include "absolute species turnover", "Whittaker's species turnover" and "proportional species turnover".
In ecology, gamma diversity (γ-diversity) is the total species diversity in a landscape. The term was introduced by R. H. Whittaker together with the terms alpha diversity (α-diversity) and beta diversity (β-diversity). Whittaker's idea was that the total species diversity in a landscape (γ) is determined by two different things, the mean species diversity in sites at a more local scale (α) and the differentiation among those sites (β). According to this reasoning, alpha diversity and beta diversity constitute independent components of gamma diversity:

In ecology, local abundance is the relative representation of a species in a particular ecosystem. It is usually measured as the number of individuals found per sample. The ratio of abundance of one species to one or multiple other species living in an ecosystem is referred to as relative species abundances. Both indicators are relevant for computing biodiversity.
In ecology, the occupancy–abundance (O–A) relationship is the relationship between the abundance of species and the size of their ranges within a region. This relationship is perhaps one of the most well-documented relationships in macroecology, and applies both intra- and interspecifically. In most cases, the O–A relationship is a positive relationship. Although an O–A relationship would be expected, given that a species colonizing a region must pass through the origin and could reach some theoretical maximum abundance and distribution, the relationship described here is somewhat more substantial, in that observed changes in range are associated with greater-than-proportional changes in abundance. Although this relationship appears to be pervasive, and has important implications for the conservation of endangered species, the mechanism(s) underlying it remain poorly understood.

The Theory of Island Biogeography is a 1967 book by the ecologist Robert MacArthur and the biologist Edward O. Wilson. It is widely regarded as a seminal work in island biogeography and ecology. The Princeton University Press reprinted the book in 2001 as a part of the "Princeton Landmarks in Biology" series. The book popularized the theory that insular biota maintain a dynamic equilibrium between immigration and extinction rates. The book also popularized the concepts and terminology of r/K selection theory.
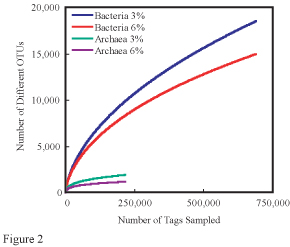
In ecology, rarefaction is a technique to assess species richness from the results of sampling. Rarefaction allows the calculation of species richness for a given number of individual samples, based on the construction of so-called rarefaction curves. This curve is a plot of the number of species as a function of the number of samples. Rarefaction curves generally grow rapidly at first, as the most common species are found, but the curves plateau as only the rarest species remain to be sampled.

The body size-species richness distribution is a pattern observed in the way taxa are distributed over large spatial scales. The number of species that exhibit small body size generally far exceed the number of species that are large-bodied. Macroecology has long sought to understand the mechanisms that underlie the patterns of biodiversity, such as the body size-species richness pattern.
Relative species abundance is a component of biodiversity and is a measure of how common or rare a species is relative to other species in a defined location or community. Relative abundance is the percent composition of an organism of a particular kind relative to the total number of organisms in the area. Relative species abundances tend to conform to specific patterns that are among the best-known and most-studied patterns in macroecology. Different populations in a community exist in relative proportions; this idea is known as relative abundance.

Elevational diversity gradient (EDG) is an ecological pattern where biodiversity changes with elevation. The EDG states that species richness tends to decrease as elevation increases, up to a certain point, creating a "diversity bulge" at middle elevations. There have been multiple hypotheses proposed for explaining the EDG, none of which accurately describe the phenomenon in full.
Dark diversity is the set of species that are absent from a study site but present in the surrounding region and potentially able to inhabit particular ecological conditions. It can be determined based on species distribution, dispersal potential and ecological needs. The term was introduced in 2011 by three researchers from the University of Tartu and was inspired by the idea of dark matter in physics since dark diversity too cannot be directly observed.

