Ecological pyramid

Last updated
A pyramid of energy represents how much energy, initially from the sun, is retained or stored in the form of new biomass at each trophic level in an ecosystem. Typically, about 10% of the energy is transferred from one trophic level to the next, thus preventing a large number of trophic levels. Energy pyramids are necessarily upright in healthy ecosystems, that is, there must always be more energy available at a given level of the pyramid to support the energy and biomass requirement of the next trophic level. Ecological Pyramid.png
A pyramid of energy represents how much energy, initially from the sun, is retained or stored in the form of new biomass at each trophic level in an ecosystem. Typically, about 10% of the energy is transferred from one trophic level to the next, thus preventing a large number of trophic levels. Energy pyramids are necessarily upright in healthy ecosystems, that is, there must always be more energy available at a given level of the pyramid to support the energy and biomass requirement of the next trophic level.

An ecological pyramid (also trophic pyramid, Eltonian pyramid, energy pyramid, or sometimes food pyramid) is a graphical representation designed to show the biomass or bioproductivity at each trophic level in an ecosystem.

Contents

A pyramid of energy shows how much energy is retained in the form of new biomass from each trophic level, while a pyramid of biomass shows how much biomass (the amount of living or organic matter present in an organism) is present in the organisms. There is also a pyramid of numbers representing the number of individual organisms at each trophic level. Pyramids of energy are normally upright, but other pyramids can be inverted (pyramid of biomass for marine region) or take other shapes (spindle shaped pyramid).

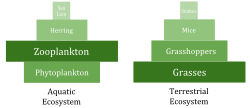
Ecological pyramids begin with producers on the bottom (such as plants) and proceed through the various trophic levels (such as herbivores that eat plants, then carnivores that eat flesh, then omnivores that eat both plants and flesh, and so on). The highest level is the top of the food chain.

Biomass can be measured by a bomb calorimeter.

Pyramid of Energy

A pyramid of energy or pyramid of productivity shows the production or turnover (the rate at which energy or mass is transferred from one trophic level to the next) of biomass at each trophic level. Instead of showing a single snapshot in time, productivity pyramids show the flow of energy through the food chain. Typical units are grams per square meter per year or calories per square meter per year. As with the others, this graph shows producers at the bottom and higher trophic levels on top.

When an ecosystem is healthy, this graph produces a standard ecological pyramid. This is because, in order for the ecosystem to sustain itself, there must be more energy at lower trophic levels than there is at higher trophic levels. This allows organisms on the lower levels to not only maintain a stable population, but also to transfer energy up the pyramid. The exception to this generalization is when portions of a food web are supported by inputs of resources from outside the local community. In small, forested streams, for example, the volume of higher levels is greater than could be supported by the local primary production.

Energy usually enters ecosystems from the Sun. The primary producers at the base of the pyramid use solar radiation to power photosynthesis which produces food. However most wavelengths in solar radiation cannot be used for photosynthesis, so they are reflected back into space or absorbed elsewhere and converted to heat. Only 1 to 2 percent of the energy from the sun is absorbed by photosynthetic processes and converted into food. [1] When energy is transferred to higher trophic levels, on average only about 10% is used at each level to build biomass, becoming stored energy. The rest goes to metabolic processes such as growth, respiration, and reproduction. [2]

Advantages of the pyramid of energy as a representation:

Disadvantages of the pyramid of energy as a representation:

Pyramid of biomass

A pyramid of biomass shows the total biomass of the organisms involved at each trophic level of an ecosystem. These pyramids are not necessarily upright. There can be lower amounts of biomass at the bottom of the pyramid if the rate of primary production per unit biomass is high. Numbers Pyramid.svg
A pyramid of biomass shows the total biomass of the organisms involved at each trophic level of an ecosystem. These pyramids are not necessarily upright. There can be lower amounts of biomass at the bottom of the pyramid if the rate of primary production per unit biomass is high.

A pyramid of biomass shows the relationship between biomass and trophic level by quantifying the biomass present at each trophic level of an ecological community at a particular time. It is a graphical representation of biomass (total amount of living or organic matter in an ecosystem) present in unit area in different trophic levels. Typical units are grams per square meter, or calories per square meter. The pyramid of biomass may be "inverted". For example, in a pond ecosystem, the standing crop of phytoplankton, the major producers, at any given point will be lower than the mass of the heterotrophs, such as fish and insects. This is explained as the phytoplankton reproduce very quickly, but have much shorter individual lives.

Pyramid of Numbers

A pyramid of numbers shows the number of individual organisms involved at each trophic level in an ecosystem. The pyramids are not necessarily upright. In some ecosystems there can be more primary consumers than producers. Biomass Pyramid.svg
A pyramid of numbers shows the number of individual organisms involved at each trophic level in an ecosystem. The pyramids are not necessarily upright. In some ecosystems there can be more primary consumers than producers.

A pyramid of numbers shows graphically the population, or abundance, in terms of the number of individual organisms involved at each level in a food chain. This shows the number of organisms in each trophic level without any consideration for their individual sizes or biomass. The pyramid is not necessarily upright. For example, it will be inverted if beetles are feeding from the output of forest trees, or parasites are feeding on large host animals.

History

The concept of pyramid of numbers ("Eltonian pyramid") was developed by Charles Elton (1927). [3] Later, it would also be expressed in terms of biomass by Bodenheimer (1938). [4] The idea of pyramid of productivity or energy relies on works of G. Evelyn Hutchinson and Raymond Lindeman (1942). [5] [6]

See also

Related Research Articles

<span class="mw-page-title-main">Ecosystem</span> Community of living organisms together with the nonliving components of their environment

An ecosystem is a system that environments and their organisms form through their interaction. The biotic and abiotic components are linked together through nutrient cycles and energy flows.

<span class="mw-page-title-main">Plankton</span> Organisms living in water or air that are drifters on the current or wind

Plankton are the diverse collection of organisms found in water that are unable to propel themselves against a current. The individual organisms constituting plankton are called plankters. In the ocean, they provide a crucial source of food to many small and large aquatic organisms, such as bivalves, fish, and baleen whales.

<span class="mw-page-title-main">Biomass (ecology)</span> Total mass of living organisms in a given area (all species or selected species)

Biomass is the mass of living biological organisms in a given area or ecosystem at a given time. Biomass can refer to species biomass, which is the mass of one or more species, or to community biomass, which is the mass of all species in the community. It can include microorganisms, plants or animals. The mass can be expressed as the average mass per unit area, or as the total mass in the community.

<span class="mw-page-title-main">Phytoplankton</span> Autotrophic members of the plankton ecosystem

Phytoplankton are the autotrophic (self-feeding) components of the plankton community and a key part of ocean and freshwater ecosystems. The name comes from the Greek words φυτόν, meaning 'plant', and, meaning 'wanderer' or 'drifter'.

<span class="mw-page-title-main">Food web</span> Natural interconnection of food chains

A food web is the natural interconnection of food chains and a graphical representation of what-eats-what in an ecological community. Ecologists can broadly define all life forms as either autotrophs or heterotrophs, based on their trophic levels, the position that they occupy in the food web. To maintain their bodies, grow, develop, and to reproduce, autotrophs produce organic matter from inorganic substances, including both minerals and gases such as carbon dioxide. These chemical reactions require energy, which mainly comes from the Sun and largely by photosynthesis, although a very small amount comes from bioelectrogenesis in wetlands, and mineral electron donors in hydrothermal vents and hot springs. These trophic levels are not binary, but form a gradient that includes complete autotrophs, which obtain their sole source of carbon from the atmosphere, mixotrophs, which are autotrophic organisms that partially obtain organic matter from sources other than the atmosphere, and complete heterotrophs that must feed to obtain organic matter.

<span class="mw-page-title-main">Primary production</span> Synthesis of organic compounds from carbon dioxide by biological organisms

In ecology, primary production is the synthesis of organic compounds from atmospheric or aqueous carbon dioxide. It principally occurs through the process of photosynthesis, which uses light as its source of energy, but it also occurs through chemosynthesis, which uses the oxidation or reduction of inorganic chemical compounds as its source of energy. Almost all life on Earth relies directly or indirectly on primary production. The organisms responsible for primary production are known as primary producers or autotrophs, and form the base of the food chain. In terrestrial ecoregions, these are mainly plants, while in aquatic ecoregions algae predominate in this role. Ecologists distinguish primary production as either net or gross, the former accounting for losses to processes such as cellular respiration, the latter not.

This glossary of ecology is a list of definitions of terms and concepts in ecology and related fields. For more specific definitions from other glossaries related to ecology, see Glossary of biology, Glossary of evolutionary biology, and Glossary of environmental science.

<span class="mw-page-title-main">Energy flow (ecology)</span> Flow of energy through food chains in ecological energetics

Energy flow is the flow of energy through living things within an ecosystem. All living organisms can be organized into producers and consumers, and those producers and consumers can further be organized into a food chain. Each of the levels within the food chain is a trophic level. In order to more efficiently show the quantity of organisms at each trophic level, these food chains are then organized into trophic pyramids. The arrows in the food chain show that the energy flow is unidirectional, with the head of an arrow indicating the direction of energy flow; energy is lost as heat at each step along the way.

<span class="mw-page-title-main">Soil food web</span> Complex living system in the soil

The soil food web is the community of organisms living all or part of their lives in the soil. It describes a complex living system in the soil and how it interacts with the environment, plants, and animals.

<span class="mw-page-title-main">Ecosystem ecology</span> Study of living and non-living components of ecosystems and their interactions

Ecosystem ecology is the integrated study of living (biotic) and non-living (abiotic) components of ecosystems and their interactions within an ecosystem framework. This science examines how ecosystems work and relates this to their components such as chemicals, bedrock, soil, plants, and animals.

<span class="mw-page-title-main">River ecosystem</span> Type of aquatic ecosystem with flowing freshwater

River ecosystems are flowing waters that drain the landscape, and include the biotic (living) interactions amongst plants, animals and micro-organisms, as well as abiotic (nonliving) physical and chemical interactions of its many parts. River ecosystems are part of larger watershed networks or catchments, where smaller headwater streams drain into mid-size streams, which progressively drain into larger river networks. The major zones in river ecosystems are determined by the river bed's gradient or by the velocity of the current. Faster moving turbulent water typically contains greater concentrations of dissolved oxygen, which supports greater biodiversity than the slow-moving water of pools. These distinctions form the basis for the division of rivers into upland and lowland rivers.

<span class="mw-page-title-main">Lake ecosystem</span> Type of ecosystem

A lake ecosystem or lacustrine ecosystem includes biotic (living) plants, animals and micro-organisms, as well as abiotic (non-living) physical and chemical interactions. Lake ecosystems are a prime example of lentic ecosystems, which include ponds, lakes and wetlands, and much of this article applies to lentic ecosystems in general. Lentic ecosystems can be compared with lotic ecosystems, which involve flowing terrestrial waters such as rivers and streams. Together, these two ecosystems are examples of freshwater ecosystems.

<span class="mw-page-title-main">Trophic level</span> Position of an organism in a food chain

The trophic level of an organism is the position it occupies in a food web. A food chain is a succession of organisms that eat other organisms and may, in turn, be eaten themselves. The trophic level of an organism is the number of steps it is from the start of the chain. A food web starts at trophic level 1 with primary producers such as plants, can move to herbivores at level 2, carnivores at level 3 or higher, and typically finish with apex predators at level 4 or 5. The path along the chain can form either a one-way flow or a food "web". Ecological communities with higher biodiversity form more complex trophic paths.

<span class="mw-page-title-main">Ecology of the San Francisco Estuary</span>

The San Francisco Estuary together with the Sacramento–San Joaquin River Delta represents a highly altered ecosystem. The region has been heavily re-engineered to accommodate the needs of water delivery, shipping, agriculture, and most recently, suburban development. These needs have wrought direct changes in the movement of water and the nature of the landscape, and indirect changes from the introduction of non-native species. New species have altered the architecture of the food web as surely as levees have altered the landscape of islands and channels that form the complex system known as the Delta.

This is a glossary of environmental science.

<span class="mw-page-title-main">Forage fish</span> Small prey fish

Forage fish, also called prey fish or bait fish, are small pelagic fish which are preyed on by larger predators for food. Predators include other larger fish, seabirds and marine mammals. Typical ocean forage fish feed near the base of the food chain on plankton, often by filter feeding. They include particularly fishes of the order Clupeiformes, but also other small fish, including halfbeaks, silversides, smelt such as capelin and goldband fusiliers.

Ecological efficiency describes the efficiency with which energy is transferred from one trophic level to the next. It is determined by a combination of efficiencies relating to organismic resource acquisition and assimilation in an ecosystem.

In ecology, the term productivity refers to the rate of generation of biomass in an ecosystem, usually expressed in units of mass per volume per unit of time, such as grams per square metre per day. The unit of mass can relate to dry matter or to the mass of generated carbon. The productivity of autotrophs, such as plants, is called primary productivity, while the productivity of heterotrophs, such as animals, is called secondary productivity.

A food chain is a linear network of links in a food web starting from producer organisms and ending at an apex predator species, detritivores, or decomposer species. A food chain also shows how organisms are related to each other by the food they eat. Each level of a food chain represents a different trophic level. A food chain differs from a food web because the complex network of different animals' feeding relations are aggregated and the chain only follows a direct, linear pathway of one animal at a time. Natural interconnections between food chains make it a food web.

<span class="mw-page-title-main">Marine food web</span> Marine consumer-resource system

Compared to terrestrial environments, marine environments have biomass pyramids which are inverted at the base. In particular, the biomass of consumers is larger than the biomass of primary producers. This happens because the ocean's primary producers are tiny phytoplankton which grow and reproduce rapidly, so a small mass can have a fast rate of primary production. In contrast, many significant terrestrial primary producers, such as mature forests, grow and reproduce slowly, so a much larger mass is needed to achieve the same rate of primary production.

References

  1. Gates DM, Thompson JN and Thompson MB (2018) Efficiency of solar energy utilization Encyclopædia Britannica. Accessed: 26 December 2019.
  2. Pauly, D. and Christensen, V (1995) "Primary production required to sustain global fisheries". Nature 374.6519: 255-257.
  3. Elton, C. 1927. Animal Ecology. New York, Macmillan Co. link.
  4. Bodenheimer, F. S. 1938. Problems of Animal Ecology. Oxford University Press. link.
  5. Lindeman, R. L. (1942). The trophic-dynamic aspect of ecology. Ecology 23: 399–418. link Archived 2017-03-29 at the Wayback Machine .
  6. Trebilco, Rowan; Baum, Julia K.; Salomon, Anne K.; Dulvy, Nicholas K. (2013). "Ecosystem ecology: size-based constraints on the pyramids of life". Trends in Ecology & Evolution. 28 (7): 423–431. doi:10.1016/j.tree.2013.03.008. ISSN   0169-5347.

Bibliography