Niche apportionment models

Last updated

Mechanistic models for niche apportionment are biological models used to explain relative species abundance distributions. These niche apportionment models describe how species break up resource pool in multi-dimensional space, determining the distribution of abundances of individuals among species. The relative abundances of species are usually expressed as a Whittaker plot, or rank abundance plot, where species are ranked by number of individuals on the x-axis, plotted against the log relative abundance of each species on the y-axis. The relative abundance can be measured as the relative number of individuals within species or the relative biomass of individuals within species.

Contents

History

Niche apportionment models were developed because ecologists sought biological explanations for relative species abundance distributions. MacArthur (1957, 1961), [1] [2] was one of the earliest to express dissatisfaction with purely statistical models, presenting instead 3 mechanistic niche apportionment models. MacArthur believed that ecological niches within a resource pool could be broken up like a stick, with each piece of the stick representing niches occupied in the community. With contributions from Sugihara (1980), [3] Tokeshi (1990, 1993, 1996) [4] [5] [6] expanded upon the broken stick model, when he generated roughly 7 mechanistic niche apportionment models. These mechanistic models provide a useful starting point for describing the species composition of communities.

Description

Figure 1. Whittaker plot of species Rank abundance for 7 most commonly considered mechanistic models for niche apportionment. The models with steeper slopes such as the Dominance preemption model represents less even communities where a few species are highly abundant and the remaining species abundances decrease sharply (see Species evenness). Alternatively, shallow sloped models such as the Dominance Decay model are representative of more even communities where many species are equally abundant and relatively few species are rare. Niche apportionment models.jpg
Figure 1. Whittaker plot of species Rank abundance for 7 most commonly considered mechanistic models for niche apportionment. The models with steeper slopes such as the Dominance preemption model represents less even communities where a few species are highly abundant and the remaining species abundances decrease sharply (see Species evenness). Alternatively, shallow sloped models such as the Dominance Decay model are representative of more even communities where many species are equally abundant and relatively few species are rare.

A niche apportionment model can be used in situations where one resource pool is either sequentially or simultaneously broken up into smaller niches by colonizing species or by speciation (clarification on resource use: species within a guild use same resources, while species within a community may not).

These models describe how species that draw from the same resource pool (e.g. a guild (ecology)) partition their niche. The resource pool is broken either sequentially or simultaneously, and the two components of the process of fragmentation of the niche include which fragment is chosen and the size of the resulting fragment (Figure 2).

Niche apportionment models have been used in the primary literature to explain, and describe changes in the relative abundance distributions of a diverse array of taxa including, freshwater insects, fish, bryophytes beetles, hymenopteran parasites, plankton assemblages and salt marsh grass.

Assumptions

Figure 2. The mechanisms with which a niche is broken. A resource pool is partitioned into niches of different sizes, which can be translated into the relative abundances of species in the total resource pool. MechanismNA.svg
Figure 2. The mechanisms with which a niche is broken. A resource pool is partitioned into niches of different sizes, which can be translated into the relative abundances of species in the total resource pool.

The mechanistic models that describe these plots work under the assumption that rank abundance plots are based on a rigorous estimate of the abundances of individuals within species and that these measures represent the actual species abundance distribution. Furthermore, whether using the number of individuals as the abundance measure or the biomass of individuals, these models assume that this quantity is directly proportional to the size of the niche occupied by an organism. One suggestion is that abundance measured as the numbers of individuals, may exhibit lower variances than those using biomass. Thus, some studies using abundance as a proxy for niche allocation may overestimate the evenness of a community. This happens because there is not a clear distinction of the relationship between body size, abundance (ecology), and resource use. Often studies fail to incorporate size structure or biomass estimates into measures of actual abundance, and these measure can create a higher variance around the niche apportionment models than abundance measured strictly as the number of individuals. [7] [8]

Tokeshi's mechanistic models of niche apportionment

Seven mechanistic models that describe niche apportionment are described below. The models are presented in the order of increasing evenness, from least even, the Dominance Pre-emption model to the most even the Dominance Decay and MacArthur Fraction models.

Dominance preemption

This model describes a situation where after initial colonization (or speciation) each new species pre-empts more than 50% of the smallest remaining niche. In a Dominance preemption model of niche apportionment the species colonize random portion between 50 and 100% of the smallest remaining niche, making this model stochastic in nature. A closely related model, the Geometric Series, [9] is a deterministic version of the Dominance pre-emption model, wherein the percentage of remaining niche space that the new species occupies (k) is always the same. In fact, the dominance pre-emption and geometric series models are conceptually similar and will produce the same relative abundance distribution when the proportion of the smaller niche filled is always 0.75. The dominance pre-emption model is the best fit to the relative abundance distributions of some stream fish communities in Texas, including some taxonomic groupings, and specific functional groupings. [10]

The Geometric (k=0.75)

Dominance-preemption.svg

Random assortment

In the random assortment model the resource pool is divided at random among simultaneously or sequentially colonizing species. This pattern could arise because the abundance measure does not scale with the amount of niche occupied by a species or because temporal-variation in species abundance or niche breadth causes discontinuity in niche apportionment over time and thus species appear to have no relationship between extent of occupancy and their niche. Tokeshi (1993) [5] explained that this model, in many ways, is similar to Caswell's neutral theory of biodiversity, mainly because species appear to act independently of each other.

Random fraction

The random fraction model describes a process where niche size is chosen at random by sequentially colonizing species. The initial species chooses a random portion of the total niche and subsequent colonizing species also choose a random portion of the total niche and divide it randomly until all species have colonized. Tokeshi (1990) [4] found this model to be compatible with some epiphytic Chiromonid shrimp communities, and more recently it has been used to explain the relative abundance distributions of phytoplankton communities, salt meadow vegetation, some communities of insects in the order Diptera, some ground beetle communities, functional and taxonomic groupings of stream fish in Texas bio-regions, and ichneumonid parasitoids. A similar model was developed by Sugihara in an attempt to provide a biological explanation for the log normal distribution of Preston (1948). [11] Sugihara's (1980) [3] Fixed Division Model was similar to the random fraction model, but the randomness of the model is drawn from a triangular distribution with a mean of 0.75 rather that a normal distribution with a mean of 0.5 used in the random fraction. Sugihara used a triangular distribution to draw the random variables because the randomness of some natural populations matches a triangular distribution with a mean of 0.75.

Random-fraction.svg

Power fraction

This model can explain a relative abundance distribution when the probability of colonization an existing niche in a resource pool is positively related to the size of that niche (measured as abundance, biomass etc.). The probability with which a portion of the niche colonized is dependent on the relative sizes of the established niches, and is scaled by an exponent k. k can take a value between 0 and 1 and if k>0 there is always a slightly higher probability that the larger niche will be colonized. This model is toted as being more biologically realistic because one can imagine many cases where the niche with the larger proportion of resources is more likely to be invaded because that niche has more resource space, and thus more opportunity for acquisition. The random fraction model of niche apportionment is an extreme of the power fraction model where k=0, and the other extreme of the power fraction, when k=1 resembles the MacArthur Fraction model where the probability of colonization is directly proportion to niche size. [6] [12]

Power-fraction.svg

MacArthur fraction

This model requires that the initial niche is broken at random and the successive niches are chosen with a probability proportional to their size. In this model the largest niche always has a greater probability of being broken relative to the smaller niches in the resource pool. This model can lead to a more even distribution where larger niches are more likely to be broken facilitating co-existence between species in equivalent sized niches. The basis for the MacArthur Fraction model is the Broken Stick, developed by MacArthur (1957). These models produce similar results, but one of the main conceptual differences is that niches are filled simultaneously in Broken Stick model rather than sequentially as in the MacArthur Fraction. Tokeshi (1993) [5] argues that sequentially invading a resource pool is more biologically realistic than simultaneously breaking the niche space. When the abundance of fish from all bio-regions in Texas were combined the distribution resembled the broken stick model of niche apportionment, suggesting a relatively even distribution of freshwater fish species in Texas. [10]

Macarthur-fraction.svg

Dominance decay

This model can be thought of as the inverse to the Dominance pre-emption model. First, the initial resource pool is colonized randomly and the remaining, subsequent colonizers always colonize the largest niche, whether or not it is already colonized. This model generates the most even community relative to the niche apportionment models described above because the largest niche is always broken into two smaller fragments that are more likely to be equivalent to the size of the smaller niche that was not broken. Communities of this “level” of evenness seem to be rare in natural systems. However, one such community includes the relative abundance distribution of filter feeders in one site within the River Danube in Austria. [13]

Dominance-decay.svg

Composite

A composite model exists when a combination of niche apportionment models are acting in different portions of the resource pool. Fesl (2002). [13] shows how a composite model might appear in a study of freshwater Diptera, in that different niche apportionment models fit different functional groups of the data. Another example by Higgins and Strauss (2008), modeling fish assemblages, found that fish communities from different habitats and with different species compositions conform to different niche apportionment models, thus the entire species assemblage was a combination of models in different regions of the species range.

Fitting mechanistic models of niche apportionment to empirical data

Mechanistic models of niche apportionment are intended to describe communities. Researchers have used these models in many ways to investigate the temporal and geographic trends in species abundance.

For many years the fit of niche apportionment models was conducted by eye and graphs of the models were compared with empirical data. [5] More recently statistical tests of the fit of niche apportionment models to empirical data have been developed. [14] [15] The later method (Etienne and Ollf 2005) [15] uses a Bayesian simulation of the models to test their fit to empirical data. The former method, which is still commonly used, simulates the expected relative abundances, from a normal distribution, of each model given the same number of species as the empirical data. Each model is simulated multiple times, and mean and standard deviation can be calculated to assign confidence intervals around each relative abundance distribution. The confidence around each rank can be tested against empirical data for each model to determine model fit. The confidence intervals are calculated as follows. [4] [12] For more information on the simulation of niche apportionment models the website [ permanent dead link ], which explains the program Power Niche. [14]

r=confidence limit of simulated data σ=standard deviation of simulated data n=number of replicates of empirical sample

Related Research Articles

Theoretical ecology

Theoretical ecology is the scientific discipline devoted to the study of ecological systems using theoretical methods such as simple conceptual models, mathematical models, computational simulations, and advanced data analysis. Effective models improve understanding of the natural world by revealing how the dynamics of species populations are often based on fundamental biological conditions and processes. Further, the field aims to unify a diverse range of empirical observations by assuming that common, mechanistic processes generate observable phenomena across species and ecological environments. Based on biologically realistic assumptions, theoretical ecologists are able to uncover novel, non-intuitive insights about natural processes. Theoretical results are often verified by empirical and observational studies, revealing the power of theoretical methods in both predicting and understanding the noisy, diverse biological world.

Ecological niche The fit of a species living under specific environmental conditions.

In ecology, a niche is the match of a species to a specific environmental condition. It describes how an organism or population responds to the distribution of resources and competitors and how it in turn alters those same factors. "The type and number of variables comprising the dimensions of an environmental niche vary from one species to another [and] the relative importance of particular environmental variables for a species may vary according to the geographic and biotic contexts".

Competitive exclusion principle A proposition that two species competing for the same limiting resource cannot coexist at constant population values

In ecology, the competitive exclusion principle, sometimes referred to as Gause's law, is a proposition named for Georgy Gause that two species competing for the same limited resource cannot coexist at constant population values. When one species has even the slightest advantage over another, the one with the advantage will dominate in the long term. This leads either to the extinction of the weaker competitor or to an evolutionary or behavioral shift toward a different ecological niche. The principle has been paraphrased in the maxim "complete competitors can not coexist".

Unified neutral theory of biodiversity theory of evolutionary biology

The unified neutral theory of biodiversity and biogeography is a theory and the title of a monograph by ecologist Stephen Hubbell. The hypothesis aims to explain the diversity and relative abundance of species in ecological communities. Like other neutral theories of ecology, Hubbell assumes that the differences between members of an ecological community of trophically similar species are "neutral", or irrelevant to their success. This implies that niche differences do not influence abundance and the abundance of each species follows a random walk. The theory has sparked controversy, and some authors consider it a more complex version of other null models that fit the data better.

Species–area relationship

The species-area relationship or species-area curve describes the relationship between the area of a habitat, or of part of a habitat, and the number of species found within that area. Larger areas tend to contain larger numbers of species, and empirically, the relative numbers seem to follow systematic mathematical relationships. The species-area relationship is usually constructed for a single type of organism, such as all vascular plants or all species of a specific trophic level within a particular site. It is rarely if ever, constructed for all types of organisms if simply because of the prodigious data requirements. It is related but not identical to the species discovery curve.

Niche segregation

Species use restricted ecological niches, and the niches of all species are segregated, often with much overlap, by the use of different habitats, different geographic areas and seasons, and different food resources, to mention only a few of the many niche dimensions. The causes of niche restriction and segregation are important problems in evolutionary ecology.

Abundance (ecology) Relative representation of a species in anr ecosystem

In ecology, local abundance is the relative representation of a species in a particular ecosystem. It is usually measured as the number of individuals found per sample. The ratio of abundance of one species to one or multiple other species living in an ecosystem is referred to as relative species abundances. Both indicators are relevant for computing biodiversity.

In ecology, the occupancy–abundance (O–A) relationship is the relationship between the abundance of species and the size of their ranges within a region. This relationship is perhaps one of the most well-documented relationships in macroecology, and applies both intra- and interspecifically. In most cases, the O–A relationship is a positive relationship. Although an O–A relationship would be expected, given that a species colonizing a region must pass through the origin and could reach some theoretical maximum abundance and distribution, the relationship described here is somewhat more substantial, in that observed changes in range are associated with greater-than-proportional changes in abundance. Although this relationship appears to be pervasive, and has important implications for the conservation of endangered species, the mechanism(s) underlying it remain poorly understood

In spatial ecology and macroecology, scaling pattern of occupancy (SPO), also known as the area-of-occupancy (AOO) is the way in which species distribution changes across spatial scales. In physical geography and image analysis, it is similar to the modifiable areal unit problem. Simon A. Levin (1992) states that the problem of relating phenomena across scales is the central problem in biology and in all of science. Understanding the SPO is thus one central theme in ecology.

Community assembly rules are a set of controversial rules in ecology, first proposed by Jared Diamond.

<i>The Theory of Island Biogeography</i> 1967 book by Robert MacArthur and Edward O. Wilson

The Theory of Island Biogeography is a 1967 book by the ecologist Robert MacArthur and the biologist Edward O. Wilson. It is widely regarded as a seminal piece in island biogeography and ecology. The Princeton University Press reprinted the book in 2001 as a part of the "Princeton Landmarks in Biology" series. The book popularized the theory that insular biota maintain a dynamic equilibrium between immigration and extinction rates. The book also popularized the concepts and terminology of r/K selection theory.

An ecological metacommunity is a set of interacting communities which are linked by the dispersal of multiple, potentially interacting species. The term is derived from the field of community ecology, which is primarily concerned with patterns of species distribution, abundance and interactions. Metacommunity ecology combines the importance of local factors and regional factors to explain patterns of species distributions that happen in different spatial scales.

Ecological forecasting uses knowledge of physics, ecology and physiology to predict how ecological populations, communities, or ecosystems will change in the future in response to environmental factors such as climate change. The ultimate goal of the approach is to provide people such as resource managers and designers of marine reserves with information that they can then use to respond, in advance, to future changes, a form of adaptation to global warming.

Body size and species richness

The body size-species richness distribution is a pattern observed in the way taxa are distributed over large spatial scales. The number of species that exhibit small body size generally far exceed the number of species that are large-bodied. Macroecology has long sought to understand the mechanisms that underlie the patterns of biodiversity, such as the body size-species richness pattern.

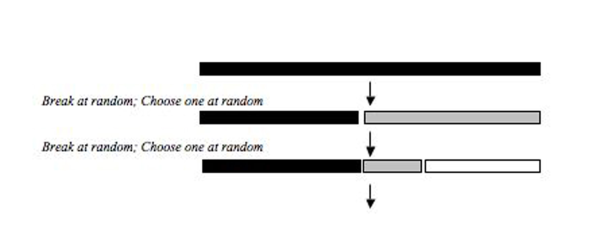
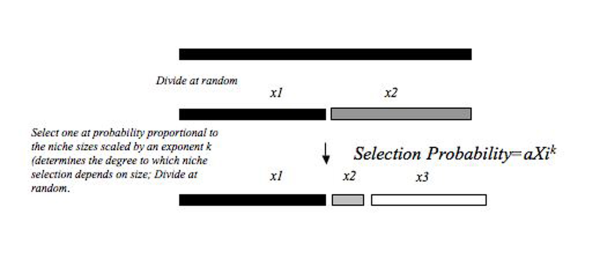
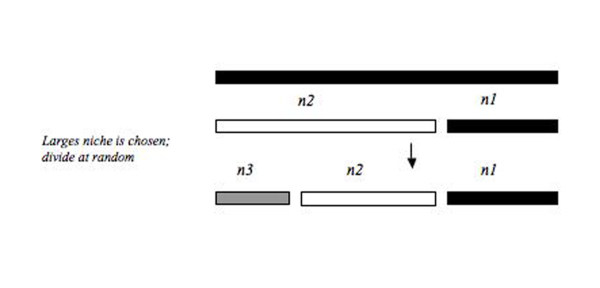
Relative species abundance is a component of biodiversity and refers to how common or rare a species is relative to other species in a defined location or community. Relative abundance is the percent composition of an organism of a particular kind relative to the total number of organisms in the area. Relative species abundances tend to conform to specific patterns that are among the best-known and most-studied patterns in macroecology. Different populations in a community exist in relative proportions; this idea is known as relative abundance.

Limiting similarity is a concept in theoretical ecology and community ecology that proposes the existence of a maximum level of niche overlap between two given species that will allow continued coexistence.

Species distribution modelling

Species distribution modelling (SDM), also known as environmental(or ecological) niche modelling (ENM), habitat modelling, predictive habitat distribution modelling, and range mapping uses computer algorithms to predict the distribution of a species across geographic space and time using environmental data. The environmental data are most often climate data, but can include other variables such as soil type, water depth, and land cover. SDMs are used in several research areas in conservation biology, ecology and evolution. These models can be used to understand how environmental conditions influence the occurrence or abundance of a species, and for predictive purposes. Predictions from an SDM may be of a species’ future distribution under climate change, a species’ past distribution in order to assess evolutionary relationships, or the potential future distribution of an invasive species. Predictions of current and/or future habitat suitability can be useful for management applications.

No-analog in paleoecology and ecological forecasting are those communities or climates that are compositionally different from a baseline for measurement of communities or climate, which is typically modern. Alternative naming conventions to describe no-analog communities and climates may include novel, emerging, mosaic, disharmonious and intermingled.

In macroecology and community ecology, an occupancy frequency distribution (OFD) is the distribution of the numbers of species occupying different numbers of areas. It was first reported in 1918 by the Danish botanist Christen C. Raunkiær in his study on plant communities. The OFD is also known as the species-range size distribution in literature.

The ecological and biogeographical concept of the species pool describes all species available that could potentially colonize and inhabit a focal habitat area. The concept lays emphasis on the fact that "local communities aren't closed systems, and that the species occupying any local site typically came from somewhere else", however, the species pool concept may suffer from the logical fallacy of composition. Most local communities, however, have just a fraction of its species pool present. It is derived from MacArthur and Wilson's Island Biogeography Theory that examines the factors that affect the species richness of isolated natural communities. It helps to understand the composition and richness of local communities and how they are influenced by biogeographic and evolutionary processes acting at large spatial and temporal scales. The absent portion of species pool—dark diversity—has been used to understand processes influencing local communities. Methods to estimate potential but absent species are developing.

References

  1. MacArthur, R. H. (1957). On the relative abundance of bird species. Proc. Natl. Acad. Sci. 43, 293-295.
  2. MacArthur, R. H. MacArthur, J. W. (1961). On bird species diversity. Ecology. 42, 594-598.
  3. 1 2 Sugihara, G. (1980). Minimal community structure: an explanation of species abundance patterns. Am. Nat. 116. 770-787.
  4. 1 2 3 Tokeshi, M. (1990). Niche apportionment or random assortment: species abundance patterns revisited. Journal of Animal Ecology. 59, 1129-1146.
  5. 1 2 3 4 Tokeshi, M. (1993). Species abundance patterns and community structure. Adv. Ecol. Res. 24, 112-186.
  6. 1 2 Tokeshi, M. (1996). Power Fraction: a new explanation for species abundance patterns in species-rich assemblages. Oikos. 75, 543-550.
  7. Gaston, K. W. Blackburn, T. M. (2000). Macroecology, Oxford, UK: Blackwell Science.
  8. Taper, M. L. Marquet, P. A. (1996). How do species really divide resources? American Naturalist. 147, 1072-1086.
  9. May, R. M. (1975). Patterns of species abundance and diversity. In Ecology and Evolution of Communities. 81-120, Cambridge, MA: Harvard University Press.
  10. 1 2 Higgins, C. L. Strauss, R. E. (2008). Modeling stream fish assemblages with niche apportionment models: patterns. processes, and scale dependence. Transactions of the American Fisheries Society. 137, 696-706.
  11. Prestion, F. W. (1948). The commonness and rarity of species. Ecology. 29, 254-253.
  12. 1 2 Magurrran, A. E. (2004). Measuring Biological Diversity. Oxford, UK: Blackwell Science
  13. 1 2 Fesl, C. (2002). Niche oriented species abundance models: different approaches and their application to larval chironomid (Diptera) assemblages in a large river. J. Anim. Ecol. 71, 1085-1094.
  14. 1 2 Drozd, P. Novotny, V. (2000). Power Niche: Niche Division models for community analysis. Version 1. Manual and program published at www.entu.cas/png/PowerNiche
  15. 1 2 Etienne, R. S. Ollf, H. (2005). Confronting different models of community structure to species-abundance data: a Bayesian model comparison. Ecology Letters. 8, 493-504.