First trophic level. The plants in this image, and the algae and phytoplankton in the lake, are primary producers. They take nutrients from the soil or the water, and manufacture their own food by photosynthesis, using energy from the sun.
Look up trophic in Wiktionary, the free dictionary.
The trophic level of an organism is the position it occupies in a food web. Within a food web, a food chain is a succession of organisms that eat other organisms and may, in turn, be eaten themselves. The trophic level of an organism is the number of steps it is from the start of the chain. A food web starts at trophic level1 with primary producers such as plants, can move to herbivores at level2, carnivores at level3 or higher, and typically finish with apex predators at level4 or 5. The path along the chain can form either a one-way flow or a part of a wider food "web". Ecological communities with higher biodiversity form more complex trophic paths.
The word trophic derives from the Greekτροφή (trophē) referring to food or nourishment.[1]
History
The concept of trophic level was developed by Raymond Lindeman (1942), based on the terminology of August Thienemann (1926): "producers", "consumers", and "reducers" (modified to "decomposers" by Lindeman).[2][3]
Overview
Consumer categories based on material eaten (plant: green shades are live, brown shades are dead; animal: red shades are live, purple shades are dead; or particulate: grey shades) and feeding strategy (gatherer: lighter shade of each color; miner: darker shade of each color)
The three basic ways in which organisms get food are as producers, consumers, and decomposers.
Producers (autotrophs) are typically plants or algae. Plants and algae do not usually eat other organisms, but pull nutrients from the soil or the ocean and manufacture their own food using photosynthesis. For this reason, they are called primary producers. In this way, it is energy from the sun that usually powers the base of the food chain.[4] An exception occurs in deep-sea hydrothermal ecosystems, where there is no sunlight. Here primary producers manufacture food through a process called chemosynthesis.[5]
Consumers (heterotrophs) are species that cannot manufacture their own food and need to consume other organisms. Animals that eat primary producers (like plants) are called herbivores. Animals that eat other animals are called carnivores, and animals that eat both plants and other animals are called omnivores.
Decomposers (detritivores) break down dead plant and animal material and wastes and release it again as energy and nutrients into the ecosystem for recycling. Decomposers, such as bacteria and fungi (mushrooms), feed on waste and dead matter, converting it into inorganic chemicals that can be recycled as mineral nutrients for plants to use again.
Trophic levels can be represented by numbers, starting at level 1 with plants. Further trophic levels are numbered subsequently according to how far the organism is along the food chain.
Level1
Plants and algae make their own food and are called producers.
Level2
Herbivores eat plants and are called primary consumers.
Level3
Carnivores that eat herbivores are called secondary consumers.
Level4
Carnivores that eat other carnivores are called tertiary consumers.
By definition, healthy adult apex predators have no predators (with members of their own species a possible exception) and are at the highest numbered level of their food web.
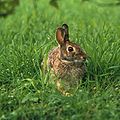
Second trophic level Rabbits eat plants at the first trophic level, so they are primary consumers.
Third trophic level Foxes eat rabbits at the second trophic level, so they are secondary consumers.
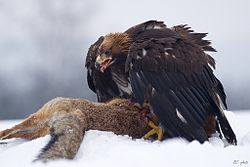
Fourth trophic level Golden eagles eat foxes at the third trophic level, so they are tertiary consumers.
Decomposers The fungi on this tree feed on dead matter, converting it back to nutrients that primary producers can use.
In real-world ecosystems, there is more than one food chain for most organisms, since most organisms eat more than one kind of food or are eaten by more than one type of predator. A diagram that sets out the intricate network of intersecting and overlapping food chains for an ecosystem is called its food web.[6] Decomposers are often left off food webs, but if included, they mark the end of a food chain.[6] Thus food chains start with primary producers and end with decay and decomposers. Since decomposers recycle nutrients, leaving them so they can be reused by primary producers, they are sometimes regarded as occupying their own trophic level.[7][8]
The trophic level of a species may vary if it has a choice of diet. Virtually all plants and phytoplankton are purely phototrophic and are at exactly level1.0. Many worms are at around 2.1; insects 2.2; jellyfish 3.0; birds 3.6.[9] A 2013 study estimates the average trophic level of human beings at 2.21, similar to pigs or anchovies.[10] This is only an average, and plainly both modern and ancient human eating habits are complex and vary greatly. For example, a traditional Inuit living on a diet consisting primarily of seals would have a trophic level of nearly 5.[11]
Biomass transfer efficiency
An energy pyramid illustrates how much energy is needed as it flows upward to support the next trophic level. Only about 10% of the energy transferred between each trophic level is converted to biomass.
In general, each trophic level relates to the one below it by absorbing some of the energy it consumes, and in this way can be regarded as resting on, or supported by, the next lower trophic level. Food chains can be diagrammed to illustrate the amount of energy that moves from one feeding level to the next in a food chain. This is called an energy pyramid. The energy transferred between levels can also be thought of as approximating to a transfer in biomass, so energy pyramids can also be viewed as biomass pyramids, picturing the amount of biomass that results at higher levels from biomass consumed at lower levels. However, when primary producers grow rapidly and are consumed rapidly, the biomass at any one moment may be low; for example, phytoplankton (producer) biomass can be low compared to the zooplankton (consumer) biomass in the same area of ocean.[12]
The efficiency with which energy or biomass is transferred from one trophic level to the next is called the ecological efficiency. Consumers at each level convert on average only about 10% of the chemical energy in their food to their own organic tissue (the ten-per cent law). For this reason, food chains rarely extend for more than 5 or 6 levels. At the lowest trophic level (the bottom of the food chain), plants convert about 1% of the sunlight they receive into chemical energy. It follows from this that the total energy originally present in the incident sunlight that is finally embodied in a tertiary consumer is about 0.001%[7]
Evolution
Both the number of trophic levels and the complexity of relationships between them evolve as life diversifies through time, the exception being intermittent mass extinction events.[13]
Fractional trophic levels
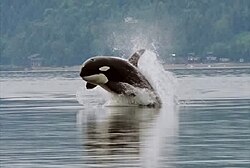
Killer whales (orca) are apex predators but they are divided into separate populations that hunt specific prey, such as tuna, small sharks, and seals.
Food webs largely define ecosystems, and the trophic levels define the position of organisms within the webs. But these trophic levels are not always simple integers, because organisms often feed at more than one trophic level.[14][15] For example, some carnivores also eat plants, and some plants are carnivores. A large carnivore may eat both smaller carnivores and herbivores; the bobcat eats rabbits, but the mountain lion eats both bobcats and rabbits. Animals can also eat each other; the bullfrog eats crayfish and crayfish eat young bullfrogs. The feeding habits of a juvenile animal, and, as a consequence, its trophic level, can change as it grows up.
The fisheries scientist Daniel Pauly sets the values of trophic levels to one in plants and detritus, two in herbivores and detritivores (primary consumers), three in secondary consumers, and so on. The definition of the trophic level, TL, for any consumer species is:[8]
where is the fractional trophic level of the prey j, and represents the fraction of j in the diet of i. That is, the consumer trophic level is one plus the weighted average of how much different trophic levels contribute to its food.
In the case of marine ecosystems, the trophic level of most fish and other marine consumers takes a value between 2.0 and 5.0. The upper value, 5.0, is unusual, even for large fish,[16] though it occurs in apex predators of marine mammals, such as polar bears and orcas.[17]
In addition to observational studies of animal behavior, and quantification of animal stomach contents, trophic level can be quantified through stable isotope analysis of animal tissues such as muscle, skin, hair, bone collagen. This is because there is a consistent increase in the nitrogen isotopic composition at each trophic level caused by fractionations that occur with the synthesis of biomolecules; the magnitude of this increase in nitrogen isotopic composition is approximately 3–4‰.[18][19]
Mean trophic level
The mean trophic level of the world fisheries catch has steadily declined because many high trophic level fish, such as this tuna, have been overfished.
In fisheries, the mean trophic level for the fisheries catch across an entire area or ecosystem is calculated for year y as:
where is the annual catch of the species or group i in year y, and is the trophic level for species i as defined above.[8]
Fish at higher trophic levels usually have a higher economic value, which can result in overfishing at the higher trophic levels. Earlier reports found precipitous declines in mean trophic level of fisheries catch, in a process known as fishing down the food web.[20] However, more recent work finds no relation between economic value and trophic level;[21] and that mean trophic levels in catches, surveys and stock assessments have not in fact declined, suggesting that fishing down the food web is not a global phenomenon.[22] However Pauly et al. note that trophic levels peaked at 3.4 in 1970 in the northwest and west-central Atlantic, followed by a subsequent decline to 2.9 in 1994. They report a shift away from long-lived, piscivorous, high-trophic-level bottom fishes, such as cod and haddock, to short-lived, planktivorous, low-trophic-level invertebrates (e.g., shrimp) and small, pelagic fish (e.g., herring). This shift from high-trophic-level fishes to low-trophic-level invertebrates and fishes is a response to changes in the relative abundance of the preferred catch. They consider that this is part of the global fishery collapse,[17][23] which finds an echo in the overfished Mediterranean Sea.[24]
Humans have a mean trophic level of about 2.21, about the same as a pig or an anchovy.[25][26]
FiB index
Since biomass transfer efficiencies are only about 10%, it follows that the rate of biological production is much greater at lower trophic levels than it is at higher levels. Fisheries catch, at least, to begin with, will tend to increase as the trophic level declines. At this point the fisheries will target species lower in the food web.[23] In 2000, this led Pauly and others to construct a "Fisheries in Balance" index, usually called the FiB index.[27] The FiB index is defined, for any year y, by[8]
where is the catch at year y, is the mean trophic level of the catch at year y, is the catch, the mean trophic level of the catch at the start of the series being analyzed, and is the transfer efficiency of biomass or energy between trophic levels.
The FiB index is stable (zero) over periods of time when changes in trophic levels are matched by appropriate changes in the catch in the opposite direction. The index increases if catches increase for any reason, e.g. higher fish biomass, or geographic expansion.[8] Such decreases explain the "backward-bending" plots of trophic level versus catch originally observed by Pauly and others in 1998.[23]
One aspect of trophic levels is called tritrophic interaction. Ecologists often restrict their research to two trophic levels as a way of simplifying the analysis; however, this can be misleading if tritrophic interactions (such as plant–herbivore–predator) are not easily understood by simply adding pairwise interactions (plant-herbivore plus herbivore–predator, for example). Significant interactions can occur between the first trophic level (plant) and the third trophic level (a predator) in determining herbivore population growth, for example. Simple genetic changes may yield morphological variants in plants that then differ in their resistance to herbivores because of the effects of the plant architecture on enemies of the herbivore.[28] Plants can also develop defenses against herbivores such as chemical defenses.[29]
↑Heinemann, A. (1926). "Der Nahrungskreislauf im Wasser"[The aquatic food cycle]. Verh. Deutsch. Zool. Ges. (in German). 31: 29–79 – via Google Books."Also available in". Zool. Anz. Suppl. (in German). 2: 29–79.
↑Odum, W. E.; Heald, E. J. (1975) "The detritus-based food web of an estuarine mangrove community". Pages 265–286 in L. E. Cronin, ed. Estuarine research. Vol. 1. Academic Press, New York.
↑Price, P. W. Price; Bouton, C. E.; Gross, P.; McPheron, B. A.; Thompson, J. N.; Weis, A. E. (1980). "Interactions Among Three Trophic Levels: Influence of Plants on Interactions Between Insect Herbivores and Natural Enemies". Annual Review of Ecology and Systematics. 11 (1): 41–65. Bibcode:1980AnRES..11...41P. doi:10.1146/annurev.es.11.110180.000353. S2CID53137184.
This page is based on this Wikipedia article Text is available under the CC BY-SA 4.0 license; additional terms may apply. Images, videos and audio are available under their respective licenses.