Species diversity is the number of different species that are represented in a given community. The effective number of species refers to the number of equally abundant species needed to obtain the same mean proportional species abundance as that observed in the dataset of interest. Meanings of species diversity may include species richness, taxonomic or phylogenetic diversity, and/or species evenness. Species richness is a simple count of species. Taxonomic or phylogenetic diversity is the genetic relationship between different groups of species. Species evenness quantifies how equal the abundances of the species are.

The unified neutral theory of biodiversity and biogeography is a theory and the title of a monograph by ecologist Stephen P. Hubbell. It aims to explain the diversity and relative abundance of species in ecological communities. Like other neutral theories of ecology, Hubbell assumes that the differences between members of an ecological community of trophically similar species are "neutral", or irrelevant to their success. This implies that niche differences do not influence abundance and the abundance of each species follows a random walk. The theory has sparked controversy, and some authors consider it a more complex version of other null models that fit the data better.

Endemism is the state of a species being found only in a single defined geographic location, such as an island, state, nation, country or other defined zone; organisms that are indigenous to a place are not endemic to it if they are also found elsewhere. For example, the Cape sugarbird is found exclusively in southwestern South Africa and is therefore said to be endemic to that particular part of the world. An endemic species can also be referred to as an endemism or, in scientific literature, as an endemite. Similarly, many species found in the Western ghats of India are examples of endemism.
The diversity of species and genes in ecological communities affects the functioning of these communities. These ecological effects of biodiversity in turn are affected by both climate change through enhanced greenhouse gases, aerosols and loss of land cover, and biological diversity, causing a rapid loss of biodiversity and extinctions of species and local populations. The current rate of extinction is sometimes considered a mass extinction, with current species extinction rates on the order of 100 to 1000 times as high as in the past.

Species richness is the number of different species represented in an ecological community, landscape or region. Species richness is simply a count of species, and it does not take into account the abundances of the species or their relative abundance distributions. Species richness is sometimes considered synonymous with species diversity, but the formal metric species diversity takes into account both species richness and species evenness.
Leaf area index (LAI) is a dimensionless quantity that characterizes plant canopies. It is defined as the one-sided green leaf area per unit ground surface area in broadleaf canopies. In conifers, three definitions for LAI have been used:
A diversity index is a method of measuring how many different types there are in a dataset. Some more sophisticated indices also account for the phylogenetic relatedness among the types. Diversity indices are statistical representations of different aspects of biodiversity, which are useful simplifications for comparing different communities or sites.
In ecology, alpha diversity (α-diversity) is the mean species diversity in a site at a local scale. The term was introduced by R. H. Whittaker together with the terms beta diversity (β-diversity) and gamma diversity (γ-diversity). Whittaker's idea was that the total species diversity in a landscape is determined by two different things, the mean species diversity in sites at a more local scale and the differentiation among those sites.
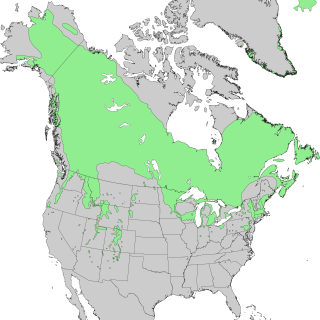
Species distribution, or speciesdispersion, is the manner in which a biological taxon is spatially arranged. The geographic limits of a particular taxon's distribution is its range, often represented as shaded areas on a map. Patterns of distribution change depending on the scale at which they are viewed, from the arrangement of individuals within a small family unit, to patterns within a population, or the distribution of the entire species as a whole (range). Species distribution is not to be confused with dispersal, which is the movement of individuals away from their region of origin or from a population center of high density.
In ecology, the occupancy–abundance (O–A) relationship is the relationship between the abundance of species and the size of their ranges within a region. This relationship is perhaps one of the most well-documented relationships in macroecology, and applies both intra- and interspecifically. In most cases, the O–A relationship is a positive relationship. Although an O–A relationship would be expected, given that a species colonizing a region must pass through the origin and could reach some theoretical maximum abundance and distribution, the relationship described here is somewhat more substantial, in that observed changes in range are associated with greater-than-proportional changes in abundance. Although this relationship appears to be pervasive, and has important implications for the conservation of endangered species, the mechanism(s) underlying it remain poorly understood.
In ecology, rarefaction is a technique to assess species richness from the results of sampling. Rarefaction allows the calculation of species richness for a given number of individual samples, based on the construction of so-called rarefaction curves. This curve is a plot of the number of species as a function of the number of samples. Rarefaction curves generally grow rapidly at first, as the most common species are found, but the curves plateau as only the rarest species remain to be sampled.
In ecology the relative abundance distribution (RAD) or species abundance distribution species abundance distribution (SAD) describes the relationship between the number of species observed in a field study as a function of their observed abundance. The SAD is one of ecology's oldest and most universal laws – every community shows a hollow curve or hyperbolic shape on a histogram with many rare species and just a few common species. When plotted as a histogram of number of species on the y-axis vs. abundance on an arithmetic x-axis, the classic hyperbolic J-curve or hollow curve is produced, indicating a few very abundant species and many rare species. The SAD is central prediction of the Unified neutral theory of biodiversity.
Mechanistic models for niche apportionment are biological models used to explain relative species abundance distributions. These niche apportionment models describe how species break up resource pool in multi-dimensional space, determining the distribution of abundances of individuals among species. The relative abundances of species are usually expressed as a Whittaker plot, or rank abundance plot, where species are ranked by number of individuals on the x-axis, plotted against the log relative abundance of each species on the y-axis. The relative abundance can be measured as the relative number of individuals within species or the relative biomass of individuals within species.
Relative species abundance is a component of biodiversity and is a measure of how common or rare a species is relative to other species in a defined location or community. Relative abundance is the percent composition of an organism of a particular kind relative to the total number of organisms in the area. Relative species abundances tend to conform to specific patterns that are among the best-known and most-studied patterns in macroecology. Different populations in a community exist in relative proportions; this idea is known as relative abundance.
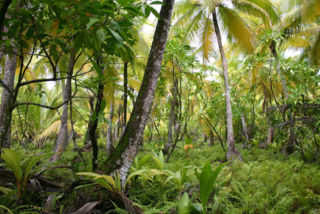
Plant ecology is a subdiscipline of ecology that studies the distribution and abundance of plants, the effects of environmental factors upon the abundance of plants, and the interactions among plants and between plants and other organisms. Examples of these are the distribution of temperate deciduous forests in North America, the effects of drought or flooding upon plant survival, and competition among desert plants for water, or effects of herds of grazing animals upon the composition of grasslands.
A variety of objective means exist to empirically measure biodiversity. Each measure relates to a particular use of the data, and is likely to be associated with the variety of genes. Biodiversity is commonly measured in terms of taxonomic richness of a geographic area over a time interval. In order to calculate biodiversity, species evenness, species richness, and species diversity are to be obtained first. Species evenness is the relative number of individuals of each species in a given area. Species richness is the number of species present in a given area. Species diversity is the relationship between species evenness and species richness. There are many ways to measure biodiversity within a given ecosystem. However, the two most popular are Shannon-Weaver diversity index, commonly referred to as Shannon diversity index, and the other is Simpsons diversity index. Although many scientists prefer to use Shannon's diversity index simply because it takes into account species richness.
In paleoecology and ecological forecasting, a no-analog community or climate is one that is compositionally different from a baseline for measurement. Alternative naming conventions to describe no-analog communities and climates may include novel, emerging, mosaic, disharmonious and intermingled.
In macroecology and community ecology, an occupancy frequency distribution (OFD) is the distribution of the numbers of species occupying different numbers of areas. It was first reported in 1918 by the Danish botanist Christen C. Raunkiær in his study on plant communities. The OFD is also known as the species-range size distribution in literature.
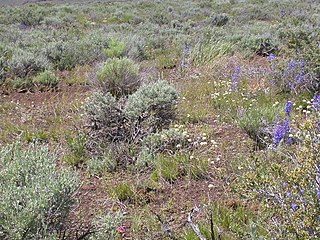
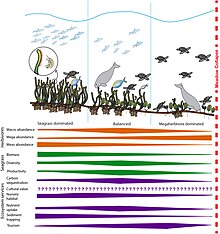
The abundances of plant species are often measured by plant cover, which is the relative area covered by different plant species in a small plot. Plant cover is not biased by the size and distributions of individuals, and is an important and often measured characteristic of the composition of plant communities.
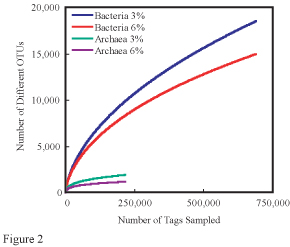
Rare biosphere refers to a large number of rare species of microbial life, i.e. bacteria, archaea and fungi, that can be found in very low concentrations in an environment.