
Infrared spectroscopy is the measurement of the interaction of infrared radiation with matter by absorption, emission, or reflection. It is used to study and identify chemical substances or functional groups in solid, liquid, or gaseous forms. It can be used to characterize new materials or identify and verify known and unknown samples. The method or technique of infrared spectroscopy is conducted with an instrument called an infrared spectrometer which produces an infrared spectrum. An IR spectrum can be visualized in a graph of infrared light absorbance on the vertical axis vs. frequency, wavenumber or wavelength on the horizontal axis. Typical units of wavenumber used in IR spectra are reciprocal centimeters, with the symbol cm−1. Units of IR wavelength are commonly given in micrometers, symbol μm, which are related to the wavenumber in a reciprocal way. A common laboratory instrument that uses this technique is a Fourier transform infrared (FTIR) spectrometer. Two-dimensional IR is also possible as discussed below.

Spectroscopy is the general field of study that measures and interprets the electromagnetic spectra that result from the interaction between electromagnetic radiation and matter as a function of the wavelength or frequency of the radiation. Matter waves and acoustic waves can also be considered forms of radiative energy, and recently gravitational waves have been associated with a spectral signature in the context of the Laser Interferometer Gravitational-Wave Observatory (LIGO)

An optical spectrometer is an instrument used to measure properties of light over a specific portion of the electromagnetic spectrum, typically used in spectroscopic analysis to identify materials. The variable measured is most often the light's intensity but could also, for instance, be the polarization state. The independent variable is usually the wavelength of the light or a unit directly proportional to the photon energy, such as reciprocal centimeters or electron volts, which has a reciprocal relationship to wavelength.

A spectrum is a condition that is not limited to a specific set of values but can vary, without gaps, across a continuum. The word was first used scientifically in optics to describe the rainbow of colors in visible light after passing through a prism. As scientific understanding of light advanced, it came to apply to the entire electromagnetic spectrum. It thereby became a mapping of a range of magnitudes (wavelengths) to a range of qualities, which are the perceived "colors of the rainbow" and other properties which correspond to wavelengths that lie outside of the visible light spectrum.
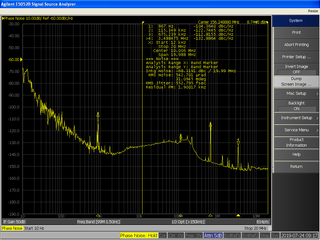
In signal processing, phase noise is the frequency-domain representation of random fluctuations in the phase of a waveform, corresponding to time-domain deviations from perfect periodicity (jitter). Generally speaking, radio-frequency engineers speak of the phase noise of an oscillator, whereas digital-system engineers work with the jitter of a clock.

X-ray photoelectron spectroscopy (XPS) is a surface-sensitive quantitative spectroscopic technique based on the photoelectric effect that can identify the elements that exist within a material or are covering its surface, as well as their chemical state, and the overall electronic structure and density of the electronic states in the material. XPS is a powerful measurement technique because it not only shows what elements are present, but also what other elements they are bonded to. The technique can be used in line profiling of the elemental composition across the surface, or in depth profiling when paired with ion-beam etching. It is often applied to study chemical processes in the materials in their as-received state or after cleavage, scraping, exposure to heat, reactive gasses or solutions, ultraviolet light, or during ion implantation.

The power spectrum of a time series describes the distribution of power into frequency components composing that signal. According to Fourier analysis, any physical signal can be decomposed into a number of discrete frequencies, or a spectrum of frequencies over a continuous range. The statistical average of a certain signal or sort of signal as analyzed in terms of its frequency content, is called its spectrum.

The emission spectrum of a chemical element or chemical compound is the spectrum of frequencies of electromagnetic radiation emitted due to an electron making a transition from a high energy state to a lower energy state. The photon energy of the emitted photon is equal to the energy difference between the two states. There are many possible electron transitions for each atom, and each transition has a specific energy difference. This collection of different transitions, leading to different radiated wavelengths, make up an emission spectrum. Each element's emission spectrum is unique. Therefore, spectroscopy can be used to identify elements in matter of unknown composition. Similarly, the emission spectra of molecules can be used in chemical analysis of substances.

A spectrum analyzer measures the magnitude of an input signal versus frequency within the full frequency range of the instrument. The primary use is to measure the power of the spectrum of known and unknown signals. The input signal that most common spectrum analyzers measure is electrical; however, spectral compositions of other signals, such as acoustic pressure waves and optical light waves, can be considered through the use of an appropriate transducer. Spectrum analyzers for other types of signals also exist, such as optical spectrum analyzers which use direct optical techniques such as a monochromator to make measurements.

Absorption spectroscopy refers to spectroscopic techniques that measure the absorption of radiation, as a function of frequency or wavelength, due to its interaction with a sample. The sample absorbs energy, i.e., photons, from the radiating field. The intensity of the absorption varies as a function of frequency, and this variation is the absorption spectrum. Absorption spectroscopy is performed across the electromagnetic spectrum.

In physics, electronics, control systems engineering, and statistics, the frequency domain refers to the analysis of mathematical functions or signals with respect to frequency, rather than time. Put simply, a time-domain graph shows how a signal changes over time, whereas a frequency-domain graph shows how much of the signal lies within each given frequency band over a range of frequencies. A frequency-domain representation can also include information on the phase shift that must be applied to each sinusoid in order to be able to recombine the frequency components to recover the original time signal.

A vector signal analyzer is an instrument that measures the magnitude and phase of the input signal at a single frequency within the IF bandwidth of the instrument. The primary use is to make in-channel measurements, such as error vector magnitude, code domain power, and spectral flatness, on known signals.
A time–frequency representation (TFR) is a view of a signal represented over both time and frequency. Time–frequency analysis means analysis into the time–frequency domain provided by a TFR. This is achieved by using a formulation often called "Time–Frequency Distribution", abbreviated as TFD.

A physical quantity is said to have a discrete spectrum if it takes only distinct values, with gaps between one value and the next.
A spectrum is a condition or value that is not limited to a specific set of values but can vary infinitely within a continuum.
Gamma-ray spectroscopy is the quantitative study of the energy spectra of gamma-ray sources, such as in the nuclear industry, geochemical investigation, and astrophysics.
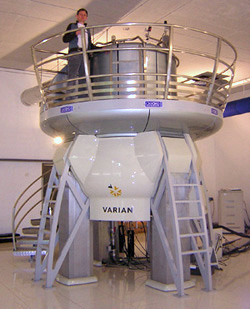
Nuclear magnetic resonance spectroscopy, most commonly known as NMR spectroscopy or magnetic resonance spectroscopy (MRS), is a spectroscopic technique to observe local magnetic fields around atomic nuclei. The sample is placed in a magnetic field and the NMR signal is produced by excitation of the nuclei sample with radio waves into nuclear magnetic resonance, which is detected with sensitive radio receivers. The intramolecular magnetic field around an atom in a molecule changes the resonance frequency, thus giving access to details of the electronic structure of a molecule and its individual functional groups. As the fields are unique or highly characteristic to individual compounds, in modern organic chemistry practice, NMR spectroscopy is the definitive method to identify monomolecular organic compounds.
In statistical signal processing, the goal of spectral density estimation (SDE) is to estimate the spectral density of a random signal from a sequence of time samples of the signal. Intuitively speaking, the spectral density characterizes the frequency content of the signal. One purpose of estimating the spectral density is to detect any periodicities in the data, by observing peaks at the frequencies corresponding to these periodicities.
Spectral line shape describes the form of a feature, observed in spectroscopy, corresponding to an energy change in an atom, molecule or ion. This shape is also referred to as the spectral line profile. Ideal line shapes include Lorentzian, Gaussian and Voigt functions, whose parameters are the line position, maximum height and half-width. Actual line shapes are determined principally by Doppler, collision and proximity broadening. For each system the half-width of the shape function varies with temperature, pressure and phase. A knowledge of shape function is needed for spectroscopic curve fitting and deconvolution.