The electromagnetic spectrum is the range of frequencies of electromagnetic radiation and their respective wavelengths and photon energies.
Frequency is the number of occurrences of a repeating event per unit of time. It is also referred to as temporal frequency, which emphasizes the contrast to spatial frequency and angular frequency. Frequency is measured in units of hertz (Hz) which is equal to one occurrence of a repeating event per second. The period is the duration of time of one cycle in a repeating event, so the period is the reciprocal of the frequency. For example: if a newborn baby's heart beats at a frequency of 120 times a minute, its period, T, — the time interval between beats—is half a second. Frequency is an important parameter used in science and engineering to specify the rate of oscillatory and vibratory phenomena, such as mechanical vibrations, audio signals (sound), radio waves, and light.

In optics, the refractive index of a material is a dimensionless number that describes how fast light travels through the material. It is defined as

A spectrum is a condition that is not limited to a specific set of values but can vary, without steps, across a continuum. The word was first used scientifically in optics to describe the rainbow of colors in visible light after passing through a prism. As scientific understanding of light advanced, it came to apply to the entire electromagnetic spectrum.
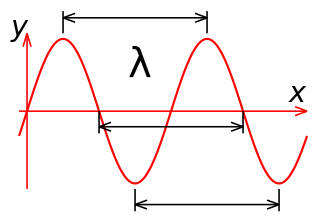
In physics, the wavelength is the spatial period of a periodic wave—the distance over which the wave's shape repeats. It is the distance between consecutive corresponding points of the same phase on the wave, such as two adjacent crests, troughs, or zero crossings, and is a characteristic of both traveling waves and standing waves, as well as other spatial wave patterns. The inverse of the wavelength is called the spatial frequency. Wavelength is commonly designated by the Greek letter lambda (λ). The term wavelength is also sometimes applied to modulated waves, and to the sinusoidal envelopes of modulated waves or waves formed by interference of several sinusoids.

The visible spectrum is the portion of the electromagnetic spectrum that is visible to the human eye. Electromagnetic radiation in this range of wavelengths is called visible light or simply light. A typical human eye will respond to wavelengths from about 380 to 740 nanometers. In terms of frequency, this corresponds to a band in the vicinity of 405–790 THz.

The reflectance of the surface of a material is its effectiveness in reflecting radiant energy. It is the fraction of incident electromagnetic power that is reflected at the boundary. Reflectance is a component of the response of the electronic structure of the material to the electromagnetic field of light, and is in general a function of the frequency, or wavelength, of the light, its polarization, and the angle of incidence. The dependence of reflectance on the wavelength is called a reflectance spectrum or spectral reflectance curve.

Wien's displacement law states that the black-body radiation curve for different temperatures will peak at different wavelengths that are inversely proportional to the temperature. The shift of that peak is a direct consequence of the Planck radiation law, which describes the spectral brightness of black-body radiation as a function of wavelength at any given temperature. However, it had been discovered by Wilhelm Wien several years before Max Planck developed that more general equation, and describes the entire shift of the spectrum of black-body radiation toward shorter wavelengths as temperature increases.

In optics, dispersion is the phenomenon in which the phase velocity of a wave depends on its frequency. Media having this common property may be termed dispersive media. Sometimes the term chromatic dispersion is used for specificity. Although the term is used in the field of optics to describe light and other electromagnetic waves, dispersion in the same sense can apply to any sort of wave motion such as acoustic dispersion in the case of sound and seismic waves, in gravity waves, and for telecommunication signals along transmission lines or optical fiber.
Thermal radiation is electromagnetic radiation generated by the thermal motion of particles in matter. All matter with a temperature greater than absolute zero emits thermal radiation. Particle motion results in charge-acceleration or dipole oscillation which produces electromagnetic radiation.
Planck's law describes the spectral density of electromagnetic radiation emitted by a black body in thermal equilibrium at a given temperature T, when there is no net flow of matter or energy between the body and its environment.
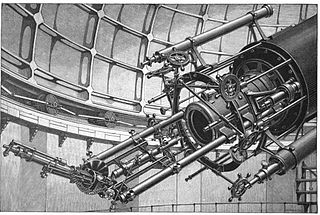
Astronomical spectroscopy is the study of astronomy using the techniques of spectroscopy to measure the spectrum of electromagnetic radiation, including visible light and radio, which radiates from stars and other celestial objects. A stellar spectrum can reveal many properties of stars, such as their chemical composition, temperature, density, mass, distance, luminosity, and relative motion using Doppler shift measurements. Spectroscopy is also used to study the physical properties of many other types of celestial objects such as planets, nebulae, galaxies, and active galactic nuclei.
The Balmer series, or Balmer lines in atomic physics, is one of a set of six named series describing the spectral line emissions of the hydrogen atom. The Balmer series is calculated using the Balmer formula, an empirical equation discovered by Johann Balmer in 1885.

The emissivity of the surface of a material is its effectiveness in emitting energy as thermal radiation. Thermal radiation is electromagnetic radiation that may include both visible radiation (light) and infrared radiation, which is not visible to human eyes. The thermal radiation from very hot objects is easily visible to the eye. Quantitatively, emissivity is the ratio of the thermal radiation from a surface to the radiation from an ideal black surface at the same temperature as given by the Stefan–Boltzmann law. The ratio varies from 0 to 1. The surface of a perfect black body emits thermal radiation at the rate of approximately 448 watts per square metre at room temperature ; all real objects have emissivities less than 1.0, and emit radiation at correspondingly lower rates.
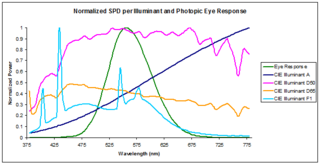
In radiometry, photometry, and color science, a spectral power distribution (SPD) measurement describes the power per unit area per unit wavelength of an illumination. More generally, the term spectral power distribution can refer to the concentration, as a function of wavelength, of any radiometric or photometric quantity.
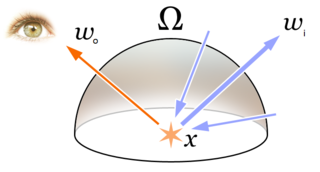
In computer graphics, the rendering equation is an integral equation in which the equilibrium radiance leaving a point is given as the sum of emitted plus reflected radiance under a geometric optics approximation. It was simultaneously introduced into computer graphics by David Immel et al. and James Kajiya in 1986. The various realistic rendering techniques in computer graphics attempt to solve this equation.
Hypsochromic shift is a change of spectral band position in the absorption, reflectance, transmittance, or emission spectrum of a molecule to a shorter wavelength. Because the blue color in the visible spectrum has a shorter wavelength than most other colors, this effect is also commonly called a blue shift.
Bathochromic shift is a change of spectral band position in the absorption, reflectance, transmittance, or emission spectrum of a molecule to a longer wavelength. Because the red color in the visible spectrum has a longer wavelength than most other colors, the effect is also commonly called a red shift.

Young stellar object (YSO) denotes a star in its early stage of evolution. This class consists of two groups of objects: protostars and pre-main-sequence stars.

The moment distance index (MDI) is a shape-based metric or shape index that can be used to analyze spectral reflectance curves and waveform LiDAR, proposed by Salas and Henebry in 2014. In the case of spectral data, the shape of the reflectance curve should unmask fine points of the spectra usually not considered by existing band-specific indices. It has been used to identify spectral regions for chlorophyll and carotenoids, detect greenhouses using WorldView-2 and Landsat satellite data, identify greenhouse crops, compute canopy heights, and estimate green vegetation fraction.


