Related Research Articles

In analytic geometry, an asymptote of a curve is a line such that the distance between the curve and the line approaches zero as one or both of the x or y coordinates tends to infinity. In projective geometry and related contexts, an asymptote of a curve is a line which is tangent to the curve at a point at infinity.
In statistics, the likelihood principle is the proposition that, given a statistical model, all the evidence in a sample relevant to model parameters is contained in the likelihood function.

In geometry, the tangent line to a plane curve at a given point is the straight line that "just touches" the curve at that point. Leibniz defined it as the line through a pair of infinitely close points on the curve. More precisely, a straight line is said to be a tangent of a curve y = f(x) at a point x = c if the line passes through the point (c, f ) on the curve and has slope f'(c), where f' is the derivative of f. A similar definition applies to space curves and curves in n-dimensional Euclidean space.
In statistics, the likelihood function measures the goodness of fit of a statistical model to a sample of data for given values of the unknown parameters. It is formed from the joint probability distribution of the sample, but viewed and used as a function of the parameters only, thus treating the random variables as fixed at the observed values.

In mathematics, an injective function is a function that maps distinct elements of its domain to distinct elements of its codomain. In other words, every element of the function's codomain is the image of at most one element of its domain. The term one-to-one function must not be confused with one-to-one correspondence that refers to bijective functions, which are functions such that each element in the codomain is an image of exactly one element in the domain.
In mathematics, differential calculus is a subfield of calculus that studies the rates at which quantities change. It is one of the two traditional divisions of calculus, the other being integral calculus—the study of the area beneath a curve.

In mathematics, the graph of a function f is the set of ordered pairs (x, y), where f(x) = y. In the common case where x and f(x) are real numbers, these pairs are Cartesian coordinates of points in two-dimensional space and thus form a subset of this plane.
In statistics, maximum likelihood estimation (MLE) is a method of estimating the parameters of a probability distribution by maximizing a likelihood function, so that under the assumed statistical model the observed data is most probable. The point in the parameter space that maximizes the likelihood function is called the maximum likelihood estimate. The logic of maximum likelihood is both intuitive and flexible, and as such the method has become a dominant means of statistical inference.

In differential calculus and differential geometry, an inflection point, point of inflection, flex, or inflection is a point on a smooth plane curve at which the curvature changes sign. In particular, in the case of the graph of a function, it is a point where the function changes from being concave to convex, or vice versa.
In mathematics, the support of a real-valued function f is the subset of the domain containing the elements which are not mapped to zero. If the domain of f is a topological space, the support of f is instead defined as the smallest closed set containing all points not mapped to zero. This concept is used very widely in mathematical analysis.
Survival analysis is a branch of statistics for analyzing the expected duration of time until one or more events happen, such as death in biological organisms and failure in mechanical systems. This topic is called reliability theory or reliability analysis in engineering, duration analysis or duration modelling in economics, and event history analysis in sociology. Survival analysis attempts to answer certain questions, such as what is the proportion of a population which will survive past a certain time? Of those that survive, at what rate will they die or fail? Can multiple causes of death or failure be taken into account? How do particular circumstances or characteristics increase or decrease the probability of survival?
In mathematics, a plane curve is a curve in a plane that may be either a Euclidean plane, an affine plane or a projective plane. The most frequently studied cases are smooth plane curves, and algebraic plane curves. Plane curves also include the Jordan curves and the graphs of continuous functions.
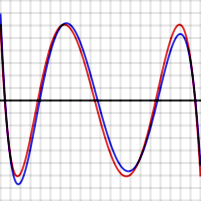
In mathematics, approximation theory is concerned with how functions can best be approximated with simpler functions, and with quantitatively characterizing the errors introduced thereby. Note that what is meant by best and simpler will depend on the application.
Critical point is a wide term used in many branches of mathematics.

In mathematics, the vertical line test is a visual way to determine if a curve is a graph of a function or not. A function can only have one output, y, for each unique input, x. If a vertical line intersects a curve on an xy-plane more than once then for one value of x the curve has more than one value of y, and so, the curve does not represent a function. If all vertical lines intersect a curve at most once then the curve represents a function.
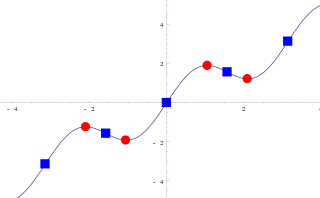
Slice sampling is a type of Markov chain Monte Carlo algorithm for pseudo-random number sampling, i.e. for drawing random samples from a statistical distribution. The method is based on the observation that to sample a random variable one can sample uniformly from the region under the graph of its density function.
The survival function is a function that gives the probability that a patient, device, or other object of interest will survive beyond any specified time.
Most of the terms listed in Wikipedia glossaries are already defined and explained within Wikipedia itself. However, glossaries like this one are useful for looking up, comparing and reviewing large numbers of terms together. You can help enhance this page by adding new terms or writing definitions for existing ones.

The Casio Algebra FX series was a line of graphing calculators manufactured by Casio Computer Co., Ltd from 1999 to 2003. They were the successor models to the CFX-9970G, the first Casio calculator with computer algebra system, or CAS, a program for symbolic manipulation of mathematical expressions. The calculators were discontinued and succeeded by the Casio ClassPad 300 in 2003.
References
- 1 2 Edwards, A. W. F. (1992) [1972]. Likelihood. Johns Hopkins University Press. ISBN 0-8018-4443-6.
| | This statistics-related article is a stub. You can help Wikipedia by expanding it. |