
Weather is the state of the atmosphere, describing for example the degree to which it is hot or cold, wet or dry, calm or stormy, clear or cloudy. On Earth, most weather phenomena occur in the lowest layer of the planet's atmosphere, the troposphere, just below the stratosphere. Weather refers to day-to-day temperature, precipitation, and other atmospheric conditions, whereas climate is the term for the averaging of atmospheric conditions over longer periods of time. When used without qualification, "weather" is generally understood to mean the weather of Earth.
Surface weather analysis is a special type of weather map that provides a view of weather elements over a geographical area at a specified time based on information from ground-based weather stations.
A weather map, also known as synoptic weather chart, displays various meteorological features across a particular area at a particular point in time and has various symbols which all have specific meanings. Such maps have been in use since the mid-19th century and are used for research and weather forecasting purposes. Maps using isotherms show temperature gradients, which can help locate weather fronts. Isotach maps, analyzing lines of equal wind speed, on a constant pressure surface of 300 or 250 hPa show where the jet stream is located. Use of constant pressure charts at the 700 and 500 hPa level can indicate tropical cyclone motion. Two-dimensional streamlines based on wind speeds at various levels show areas of convergence and divergence in the wind field, which are helpful in determining the location of features within the wind pattern. A popular type of surface weather map is the surface weather analysis, which plots isobars to depict areas of high pressure and low pressure. Cloud codes are translated into symbols and plotted on these maps along with other meteorological data that are included in synoptic reports sent by professionally trained observers.

A high-pressure area, high, or anticyclone, is an area near the surface of a planet where the atmospheric pressure is greater than the pressure in the surrounding regions. Highs are middle-scale meteorological features that result from interplays between the relatively larger-scale dynamics of an entire planet's atmospheric circulation.

In meteorology, the synoptic scale is a horizontal length scale of the order of 1,000 km (620 mi) or more. This corresponds to a horizontal scale typical of mid-latitude depressions. Most high- and low-pressure areas seen on weather maps are synoptic-scale systems, driven by the location of Rossby waves in their respective hemisphere. Low-pressure areas and their related frontal zones occur on the leading edge of a trough within the Rossby wave pattern, while high-pressure areas form on the back edge of the trough. Most precipitation areas occur near frontal zones. The word synoptic is derived from the Ancient Greek word συνοπτικός (sunoptikós), meaning "seen together".
A pressure system is a peak or lull in the sea level pressure distribution. The surface pressure at sea level varies minimally, with the lowest value measured 87 kilopascals (26 inHg) and the highest recorded 108.57 kilopascals (32.06 inHg). High- and low-pressure systems evolve due to interactions of temperature differentials in the atmosphere, temperature differences between the atmosphere and water within oceans and lakes, the influence of upper-level disturbances, as well as the amount of solar heating or radiationized cooling an area receives. Pressure systems cause weather to be experienced locally. Low-pressure systems are associated with clouds and precipitation that minimize temperature changes throughout the day, whereas high-pressure systems normally associate with dry weather and mostly clear skies with larger diurnal temperature changes due to greater radiation at night and greater sunshine during the day. Pressure systems are analyzed by those in the field of meteorology within surface weather maps.

In atmospheric science, the thermal wind is the vector difference between the geostrophic wind at upper altitudes minus that at lower altitudes in the atmosphere. It is the hypothetical vertical wind shear that would exist if the winds obey geostrophic balance in the horizontal, while pressure obeys hydrostatic balance in the vertical. The combination of these two force balances is called thermal wind balance, a term generalizable also to more complicated horizontal flow balances such as gradient wind balance.
This is a list of meteorology topics. The terms relate to meteorology, the interdisciplinary scientific study of the atmosphere that focuses on weather processes and forecasting.

A weather front is a boundary separating air masses for which several characteristics differ, such as air density, wind, temperature, and humidity. Disturbed and unstable weather due to these differences often arises along the boundary. For instance, cold fronts can bring bands of thunderstorms and cumulonimbus precipitation or be preceded by squall lines, while warm fronts are usually preceded by stratiform precipitation and fog. In summer, subtler humidity gradients known as dry lines can trigger severe weather. Some fronts produce no precipitation and little cloudiness, although there is invariably a wind shift.
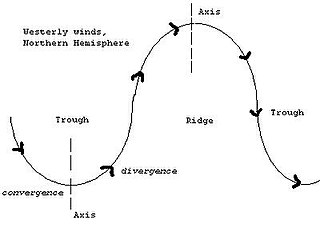
A trough is an elongated region of relatively low atmospheric pressure without a closed isobaric contour that would define it as a low pressure area. Since low pressure implies a low height on a pressure surface, troughs and ridges refer to features in an identical sense as those on a topographic map.

In meteorology a ridge or barometric ridge is an elongated area of relatively high atmospheric pressure compared to the surrounding environment, without being a closed circulation. It is associated with an area of maximum anticyclonic curvature of wind flow. The ridge originates in the center of an anticyclone and sandwiched between two low-pressure areas, and the locus of the maximum curvature is called the ridge line. This phenomenon is the opposite of a trough.

Cold air damming, or CAD, is a meteorological phenomenon that involves a high-pressure system (anticyclone) accelerating equatorward east of a north-south oriented mountain range due to the formation of a barrier jet behind a cold front associated with the poleward portion of a split upper level trough. Initially, a high-pressure system moves poleward of a north-south mountain range. Once it sloshes over poleward and eastward of the range, the flow around the high banks up against the mountains, forming a barrier jet which funnels cool air down a stretch of land east of the mountains. The higher the mountain chain, the deeper the cold air mass becomes lodged to its east, and the greater impediment it is within the flow pattern and the more resistant it becomes to intrusions of milder air.
The history of surface weather analysis concerns the timetable of developments related to surface weather analysis. Initially a tool of study for the behavior of storms, surface weather analyses became a work in progress to explain current weather and as an aid for short term weather forecasting. Initial efforts to create surface weather analyses began in the mid-19th century by using surface weather observations to analyze isobars, isotherms, and display temperature and cloud cover. By the mid-20th century, much more information was being placed upon the station models plotted on weather maps and surface fronts, per the Norwegian cyclone model, were being analyzed worldwide. Eventually, observation plotting went from a manual exercise to an automated task for computers and plotters. Surface analysis remains a manual and partially subjective exercise, whether it be via hand and paper, or via a workstation.

In meteorology, station models are symbolic illustrations showing the weather occurring at a given reporting station. Meteorologists created the station model to fit a number of weather elements into a small space on weather maps. This allows map users to analyze patterns in atmospheric pressure, temperature, wind speed and direction, cloud cover, precipitation, and other parameters. The most common station plots depict surface weather observations although upper air plots at various mandatory levels are also frequently depicted.

The following outline is provided as an overview of and topical guide to the field of Meteorology.

Surface weather observations are the fundamental data used for safety as well as climatological reasons to forecast weather and issue warnings worldwide. They can be taken manually, by a weather observer, by computer through the use of automated weather stations, or in a hybrid scheme using weather observers to augment the otherwise automated weather station. The ICAO defines the International Standard Atmosphere (ISA), which is the model of the standard variation of pressure, temperature, density, and viscosity with altitude in the Earth's atmosphere, and is used to reduce a station pressure to sea level pressure. Airport observations can be transmitted worldwide through the use of the METAR observing code. Personal weather stations taking automated observations can transmit their data to the United States mesonet through the Citizen Weather Observer Program (CWOP), the UK Met Office through their Weather Observations Website (WOW), or internationally through the Weather Underground Internet site. A thirty-year average of a location's weather observations is traditionally used to determine the station's climate. In the US a network of Cooperative Observers make a daily record of summary weather and sometimes water level information.

A cold front is the leading edge of a cooler mass of air at ground level that replaces a warmer mass of air and lies within a pronounced surface trough of low pressure. It often forms behind an extratropical cyclone, at the leading edge of its cold air advection pattern—known as the cyclone's dry "conveyor belt" flow. Temperature differences across the boundary can exceed 30 °C (54 °F) from one side to the other. When enough moisture is present, rain can occur along the boundary. If there is significant instability along the boundary, a narrow line of thunderstorms can form along the frontal zone. If instability is weak, a broad shield of rain can move in behind the front, and evaporative cooling of the rain can increase the temperature difference across the front. Cold fronts are stronger in the fall and spring transition seasons and are weakest during the summer.

A meteogram, also known as a meteorogram, is a graphical presentation of one or more meteorological variables with respect to time, whether observed or forecast, for a particular location. Where forecast data is used, the meteogram will typically be generated directly from a weather forecasting model based on the longitude, latitude and elevation of the location, but it can also be corrected by a meteorologist. Where a meteogram is used to display historical weather observations, this will typically be for a specific weather station.
A prognostic chart is a map displaying the likely weather forecast for a future time. Such charts generated by atmospheric models as output from numerical weather prediction and contain a variety of information such as temperature, wind, precipitation and weather fronts. They can also indicate derived atmospheric fields such as vorticity, stability indices, or frontogenesis. Forecast errors need to be taken into account and can be determined either via absolute error, or by considering persistence and absolute error combined.
This glossary of meteorology is a list of terms and concepts relevant to meteorology and atmospheric science, their sub-disciplines, and related fields.
