In electronics and telecommunications, modulation is the process of varying one or more properties of a periodic waveform, called the carrier signal, with a separate signal called the modulation signal that typically contains information to be transmitted. For example, the modulation signal might be an audio signal representing sound from a microphone, a video signal representing moving images from a video camera, or a digital signal representing a sequence of binary digits, a bitstream from a computer.

In telecommunications, orthogonal frequency-division multiplexing (OFDM) is a type of digital transmission used in digital modulation for encoding digital (binary) data on multiple carrier frequencies. OFDM has developed into a popular scheme for wideband digital communication, used in applications such as digital television and audio broadcasting, DSL internet access, wireless networks, power line networks, and 4G/5G mobile communications.
Quadrature amplitude modulation (QAM) is the name of a family of digital modulation methods and a related family of analog modulation methods widely used in modern telecommunications to transmit information. It conveys two analog message signals, or two digital bit streams, by changing (modulating) the amplitudes of two carrier waves, using the amplitude-shift keying (ASK) digital modulation scheme or amplitude modulation (AM) analog modulation scheme. The two carrier waves are of the same frequency and are out of phase with each other by 90°, a condition known as orthogonality or quadrature. The transmitted signal is created by adding the two carrier waves together. At the receiver, the two waves can be coherently separated (demodulated) because of their orthogonality. Another key property is that the modulations are low-frequency/low-bandwidth waveforms compared to the carrier frequency, which is known as the narrowband assumption.
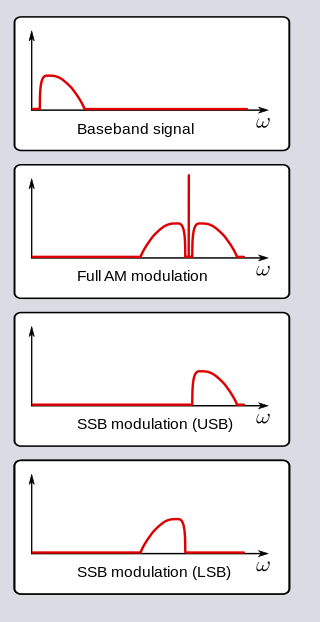
In radio communications, single-sideband modulation (SSB) or single-sideband suppressed-carrier modulation (SSB-SC) is a type of modulation used to transmit information, such as an audio signal, by radio waves. A refinement of amplitude modulation, it uses transmitter power and bandwidth more efficiently. Amplitude modulation produces an output signal the bandwidth of which is twice the maximum frequency of the original baseband signal. Single-sideband modulation avoids this bandwidth increase, and the power wasted on a carrier, at the cost of increased device complexity and more difficult tuning at the receiver.

In telecommunications and signal processing, baseband is the range of frequencies occupied by a signal that has not been modulated to higher frequencies. Baseband signals typically originate from transducers, converting some other variable into an electrical signal. For example, the electronic output of a microphone is a baseband signal that is analogous to the applied voice audio. In conventional analog radio broadcasting, the baseband audio signal is used to modulate an RF carrier signal of a much higher frequency.
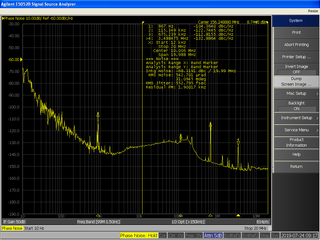
In signal processing, phase noise is the frequency-domain representation of random fluctuations in the phase of a waveform, corresponding to time-domain deviations from perfect periodicity (jitter). Generally speaking, radio-frequency engineers speak of the phase noise of an oscillator, whereas digital-system engineers work with the jitter of a clock.
Phase-shift keying (PSK) is a digital modulation process which conveys data by changing (modulating) the phase of a constant frequency carrier wave. The modulation is accomplished by varying the sine and cosine inputs at a precise time. It is widely used for wireless LANs, RFID and Bluetooth communication.
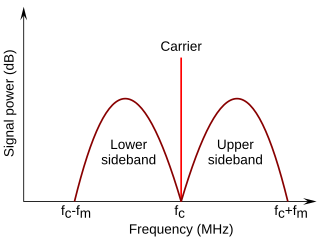
In radio communications, a sideband is a band of frequencies higher than or lower than the carrier frequency, that are the result of the modulation process. The sidebands carry the information transmitted by the radio signal. The sidebands comprise all the spectral components of the modulated signal except the carrier. The signal components above the carrier frequency constitute the upper sideband (USB), and those below the carrier frequency constitute the lower sideband (LSB). All forms of modulation produce sidebands.
Demodulation is extracting the original information-bearing signal from a carrier wave. A demodulator is an electronic circuit that is used to recover the information content from the modulated carrier wave. There are many types of modulation so there are many types of demodulators. The signal output from a demodulator may represent sound, images or binary data.
A satellite modem or satmodem is a modem used to establish data transfers using a communications satellite as a relay. A satellite modem's main function is to transform an input bitstream to a radio signal and vice versa.

A spectrum analyzer measures the magnitude of an input signal versus frequency within the full frequency range of the instrument. The primary use is to measure the power of the spectrum of known and unknown signals. The input signal that most common spectrum analyzers measure is electrical; however, spectral compositions of other signals, such as acoustic pressure waves and optical light waves, can be considered through the use of an appropriate transducer. Spectrum analyzers for other types of signals also exist, such as optical spectrum analyzers which use direct optical techniques such as a monochromator to make measurements.

A lock-in amplifier is a type of amplifier that can extract a signal with a known carrier wave from an extremely noisy environment. Depending on the dynamic reserve of the instrument, signals up to a million times smaller than noise components, potentially fairly close by in frequency, can still be reliably detected. It is essentially a homodyne detector followed by low-pass filter that is often adjustable in cut-off frequency and filter order.

A constellation diagram is a representation of a signal modulated by a digital modulation scheme such as quadrature amplitude modulation or phase-shift keying. It displays the signal as a two-dimensional xy-plane scatter diagram in the complex plane at symbol sampling instants. In a manner similar to that of a phasor diagram, the angle of a point, measured counterclockwise from the horizontal axis, represents the phase shift of the carrier wave from a reference phase; the distance of a point from the origin represents a measure of the amplitude or power of the signal.

A network analyzer is an instrument that measures the network parameters of electrical networks. Today, network analyzers commonly measure s–parameters because reflection and transmission of electrical networks are easy to measure at high frequencies, but there are other network parameter sets such as y-parameters, z-parameters, and h-parameters. Network analyzers are often used to characterize two-port networks such as amplifiers and filters, but they can be used on networks with an arbitrary number of ports.

A sinusoid with modulation can be decomposed into, or synthesized from, two amplitude-modulated sinusoids that are in quadrature phase, i.e., with a phase offset of one-quarter cycle. All three sinusoids have the same center frequency. The two amplitude-modulated sinusoids are known as the in-phase (I) and quadrature (Q) components, which describes their relationships with the amplitude- and phase-modulated carrier.

In radio, a detector is a device or circuit that extracts information from a modulated radio frequency current or voltage. The term dates from the first three decades of radio (1888-1918). Unlike modern radio stations which transmit sound on an uninterrupted carrier wave, early radio stations transmitted information by radiotelegraphy. The transmitter was switched on and off to produce long or short periods of radio waves, spelling out text messages in Morse code. Therefore, early radio receivers did not have to demodulate the radio signal, but just distinguish between the presence or absence of a radio signal, to reproduce the Morse code "dots" and "dashes". The device that performed this function in the receiver circuit was called a detector. A variety of different detector devices, such as the coherer, electrolytic detector, magnetic detector and the crystal detector, were used during the wireless telegraphy era until superseded by vacuum tube technology.

A carrier recovery system is a circuit used to estimate and compensate for frequency and phase differences between a received signal's carrier wave and the receiver's local oscillator for the purpose of coherent demodulation.
The modulation error ratio or MER is a measure used to quantify the performance of a digital radio transmitter or receiver in a communications system using digital modulation. A signal sent by an ideal transmitter or received by a receiver would have all constellation points precisely at the ideal locations, however various imperfections in the implementation or signal path cause the actual constellation points to deviate from the ideal locations.

A signal analyzer is an instrument that measures the magnitude and phase of the input signal at a single frequency within the IF bandwidth of the instrument. It employs digital techniques to extract useful information that is carried by an electrical signal. In common usage the term is related to both spectrum analyzers and vector signal analyzers. While spectrum analyzers measure the amplitude or magnitude of signals, a signal analyzer with appropriate software or programming can measure any aspect of the signal such as modulation. Today’s high-frequency signal analyzers achieve good performance by optimizing both the analog front end and the digital back end.
Non-orthogonal frequency-division multiplexing (N-OFDM) is a method of encoding digital data on multiple carrier frequencies with non-orthogonal intervals between frequency of sub-carriers. N-OFDM signals can be used in communication and radar systems.

