Wagner's gene network model

Last updated

Wagner's gene network model is a computational model of artificial gene networks, which explicitly modeled the developmental and evolutionary process of genetic regulatory networks. A population with multiple organisms can be created and evolved from generation to generation. It was first developed by Andreas Wagner in 1996 [1] and has been investigated by other groups to study the evolution of gene networks, gene expression, robustness, plasticity and epistasis. [2] [3] [4]

Population All the organisms of a given species that live in the specified region

In biology, a population is all the organisms of the same group or species, which live in a particular geographical area, and have the capability of interbreeding. The area of a sexual population is the area where inter-breeding is potentially possible between any pair within the area, and where the probability of interbreeding is greater than the probability of cross-breeding with individuals from other areas.

Andreas Wagner

Andreas Wagner is an Austrian/US evolutionary biologist and professor at the University of Zürich, Switzerland. He is known for his work on the role of robustness and innovation in biological evolution. Wagner is professor and chairman at the Department of Evolutionary Biology and Environmental Studies at the University of Zürich.

Gene expression conversion of a genes sequence into a mature gene product or products

Gene expression is the process by which information from a gene is used in the synthesis of a functional gene product. These products are often proteins, but in non-protein coding genes such as transfer RNA (tRNA) or small nuclear RNA (snRNA) genes, the product is a functional RNA.

Contents

Assumptions

The model and its variants have a number of simplifying assumptions. Three of them are listing below.

  1. The organisms are modeled as gene regulatory networks. The models assume that gene expression is regulated exclusively at the transcriptional level;
  2. The product of a gene can regulate the expression of (be a regulator of) that source gene or other genes. The models assume that a gene can only produce one active transcriptional regulator;
  3. The effects of one regulator are independent of effects of other regulators on the same target gene.

Genotype

Network representation of the regulatory interactions between four genes (G1, G2, G3 and G4). Activations and repressions are denoted by arrows and bars, respectively. Numbers indicate the relative interaction strengths. Interaction matrix
R
{\displaystyle R}
on the right representing the network on the left. WagnerModel.png
Network representation of the regulatory interactions between four genes (G1, G2, G3 and G4). Activations and repressions are denoted by arrows and bars, respectively. Numbers indicate the relative interaction strengths. Interaction matrix on the right representing the network on the left.

The model represents individuals as networks of interacting transcriptional regulators. Each individual expresses genes encoding transcription factors. The product of each gene can regulate the expression level of itself and/or the other genes through cis-regulatory elements. The interactions among genes constitute a gene network that is represented by a × regulatory matrix in the model. The elements in matrix R represent the interaction strength. Positive values within the matrix represent the activation of the target gene, while negative ones represent repression. Matrix elements with value 0 indicate the absence of interactions between two genes.

Cis-regulatory elements (CREs) are regions of non-coding DNA which regulate the transcription of neighboring genes. CREs are vital components of genetic regulatory networks, which in turn control morphogenesis, the development of anatomy, and other aspects of embryonic development, studied in evolutionary developmental biology.

Phenotype

An example of how the gene expression pattern modeled in Wagner model and its variants. G1, G2, G3 and G4 represent genes in the network. Filled box means the gene expression of that particular gene is on; open box means off. Gene expression patterns are represented by the state vector
S
{\displaystyle S}
whose elements
s
i
(
t
)
{\displaystyle s_{i}(t)}
describe the expression states of gene
i
{\displaystyle i}
. GeneExpressionInWagnerModel.png
An example of how the gene expression pattern modeled in Wagner model and its variants. G1, G2, G3 and G4 represent genes in the network. Filled box means the gene expression of that particular gene is on; open box means off. Gene expression patterns are represented by the state vector whose elements describe the expression states of gene .

The phenotype of each individual is modeled as the gene expression pattern at time . It is represented by a state vector in this model.

whose elements denotes the expression states of gene i at time t. In the original Wagner model,

where 1 represents the gene is expressed while -1 implies the gene is not expressed. The expression pattern can only be ON or OFF. The continuous expression pattern between -1 (or 0) and 1 is also implemented in some other variants. [2] [3] [4]

Development

The development process is modeled as the development of gene expression states. The gene expression pattern at time is defined as the initial expression state. The interactions among genes change the expression states during the development process. This process is modeled by the following differential equations

τσ

= σ

where τ) represents the expression state of at time t+τ. It is determined by a filter function σ. represents the weighted sum of regulatory effects () of all genes on gene at time t. In the original Wagner model, the filter function is a step function

σ if if if

In other variants, the filter function is implemented as a sigmoidal function

σ

In this way, the expression states will acquire a continuous distribution. The gene expression will reach the final state if it reaches a stable pattern.

Evolution

Evolutionary simulations are performed by reproduction-mutation-selection life cycle. Populations are fixed at size N and they will not go extinct. Non-overlapping generations are employed. In a typical evolutionary simulation, a single random viable individual that can produce a stable gene expression pattern is chosen as the founder. Cloned individuals are generated to create a population of N identical individuals. According to the asexual or sexual reproductive mode, offspring are produced by randomly choosing (with replacement) parent individual(s) from current generation. Mutations can be acquired with probability μ and survive with probability equal to their fitness. This process is repeated until N individuals are produced that go on to found the following generation.

Fitness

Fitness in this model is the probability that an individual survives to reproduce. In the simplest implementation of the model, developmentally stable genotypes survive (i.e. their fitness is 1) and developmentally unstable ones do not (i.e. their fitness is 0).

Mutation

Mutations are modeled as the changes in gene regulation, i.e., the changes of the elements in the regulatory matrix .

Reproduction

Both sexual and asexual reproductions are implemented. Asexual reproduction is implemented as producing the offspring's genome (the gene network) by directly copying the parent's genome. Sexual reproduction is implemented as the recombination of the two parents' genomes.

Sexual reproduction Reproduction process that creates a new organism by combining the genetic material of two organisms

Sexual reproduction is a type of life cycle where generations alternate between cells with a single set of chromosomes (haploid) and cells with a double set of chromosomes (diploid). Sexual reproduction is by far the most common life cycle in eukaryotes, for example animals and plants.

Asexual reproduction Biological process in which new individuals are produced by either a single cell or a group of cells, in the absence of any sexual process

Asexual reproduction is a type of reproduction by which offspring arise from a single organism, and inherit the genes of that parent only; it does not involve the fusion of gametes, and almost never changes the number of chromosomes. Asexual reproduction is the primary form of reproduction for single-celled organisms such as archaea and bacteria. Many plants and fungi sometimes reproduce asexually. Some Asexual cells die when they are very young.

Genome entirety of an organisms hereditary information; genome of organism (encoded by the genomic DNA) is the (biological) information of heredity which is passed from one generation of organism to the next; is transcribed to produce various RNAs

In the fields of molecular biology and genetics, a genome is the genetic material of an organism. It consists of DNA. The genome includes both the genes and the noncoding DNA, as well as mitochondrial DNA and chloroplast DNA. The study of the genome is called genomics.

Selection

An organism is considered viable if it reaches a stable gene expression pattern. An organism with oscillated expression pattern is discarded and cannot enter the next generation.

Related Research Articles

Multivariate normal distribution

In probability theory and statistics, the multivariate normal distribution, multivariate Gaussian distribution, or joint normal distribution is a generalization of the one-dimensional (univariate) normal distribution to higher dimensions. One definition is that a random vector is said to be k-variate normally distributed if every linear combination of its k components has a univariate normal distribution. Its importance derives mainly from the multivariate central limit theorem. The multivariate normal distribution is often used to describe, at least approximately, any set of (possibly) correlated real-valued random variables each of which clusters around a mean value.

Principal component analysis conversion of a set of observations of possibly correlated variables into a set of values of linearly uncorrelated variables called principal components

Principal component analysis (PCA) is a statistical procedure that uses an orthogonal transformation to convert a set of observations of possibly correlated variables into a set of values of linearly uncorrelated variables called principal components. If there are observations with variables, then the number of distinct principal components is . This transformation is defined in such a way that the first principal component has the largest possible variance, and each succeeding component in turn has the highest variance possible under the constraint that it is orthogonal to the preceding components. The resulting vectors are an uncorrelated orthogonal basis set. PCA is sensitive to the relative scaling of the original variables.

Singular value decomposition matrix decomposition

In linear algebra, the singular-value decomposition (SVD) is a factorization of a real or complex matrix. It is the generalization of the eigendecomposition of a positive semidefinite normal matrix to any matrix via an extension of the polar decomposition. It has many useful applications in signal processing and statistics.

In mathematics, a Gaussian function, often simply referred to as a Gaussian, is a function of the form:

Quantitative genetics The study of the inheritance of continuously variable traits

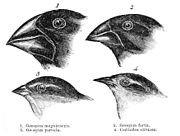
Quantitative genetics is a branch of population genetics that deals with phenotypes that vary continuously —as opposed to discretely identifiable phenotypes and gene-products.

Gene regulatory network collection of molecular regulators

A generegulatory network (GRN) is a collection of molecular regulators that interact with each other and with other substances in the cell to govern the gene expression levels of mRNA and proteins. These play a central role in morphogenesis, the creation of body structures, which in turn is central to evolutionary developmental biology (evo-devo).

Latent semantic analysis (LSA) is a technique in natural language processing, in particular distributional semantics, of analyzing relationships between a set of documents and the terms they contain by producing a set of concepts related to the documents and terms. LSA assumes that words that are close in meaning will occur in similar pieces of text. A matrix containing word counts per paragraph is constructed from a large piece of text and a mathematical technique called singular value decomposition (SVD) is used to reduce the number of rows while preserving the similarity structure among columns. Paragraphs are then compared by taking the cosine of the angle between the two vectors formed by any two columns. Values close to 1 represent very similar paragraphs while values close to 0 represent very dissimilar paragraphs.

Total least squares

In applied statistics, total least squares is a type of errors-in-variables regression, a least squares data modeling technique in which observational errors on both dependent and independent variables are taken into account. It is a generalization of Deming regression and also of orthogonal regression, and can be applied to both linear and non-linear models.

In computer programming, gene expression programming (GEP) is an evolutionary algorithm that creates computer programs or models. These computer programs are complex tree structures that learn and adapt by changing their sizes, shapes, and composition, much like a living organism. And like living organisms, the computer programs of GEP are also encoded in simple linear chromosomes of fixed length. Thus, GEP is a genotype–phenotype system, benefiting from a simple genome to keep and transmit the genetic information and a complex phenotype to explore the environment and adapt to it.

Ordinary least squares method for estimating the unknown parameters in a linear regression model

In statistics, ordinary least squares (OLS) is a type of linear least squares method for estimating the unknown parameters in a linear regression model. OLS chooses the parameters of a linear function of a set of explanatory variables by the principle of least squares: minimizing the sum of the squares of the differences between the observed dependent variable in the given dataset and those predicted by the linear function.

Biclustering, block clustering , co-clustering, or two-mode clustering is a data mining technique which allows simultaneous clustering of the rows and columns of a matrix. The term was first introduced by Boris Mirkin to name a technique introduced many years earlier, in 1972, by J. A. Hartigan.

Flux balance analysis in chemical engineering/systems biology

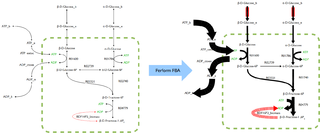
Flux balance analysis (FBA) is a mathematical method for simulating metabolism in genome-scale reconstructions of metabolic networks. In comparison to traditional methods of modeling, FBA is less intensive in terms of the input data required for constructing the model. Simulations performed using FBA are computationally inexpensive and can calculate steady-state metabolic fluxes for large models in a few seconds on modern personal computers.

CMA-ES stands for covariance matrix adaptation evolution strategy. Evolution strategies (ES) are stochastic, derivative-free methods for numerical optimization of non-linear or non-convex continuous optimization problems. They belong to the class of evolutionary algorithms and evolutionary computation. An evolutionary algorithm is broadly based on the principle of biological evolution, namely the repeated interplay of variation and selection: in each generation (iteration) new individuals are generated by variation, usually in a stochastic way, of the current parental individuals. Then, some individuals are selected to become the parents in the next generation based on their fitness or objective function value . Like this, over the generation sequence, individuals with better and better -values are generated.

Network motif Sub-graphs that repeat themselves in a specific network or even among various networks.

All networks, including biological networks, social networks, technological networks and more, can be represented as graphs, which include a wide variety of subgraphs. One important local property of networks are so-called network motifs, which are defined as recurrent and statistically significant sub-graphs or patterns.

In probability theory, the rectified Gaussian distribution is a modification of the Gaussian distribution when its negative elements are reset to 0. It is essentially a mixture of a discrete distribution and a continuous distribution as a result of censoring.

An attractor network is a type of recurrent dynamical network, that evolves toward a stable pattern over time. Nodes in the attractor network converge toward a pattern that may either be fixed-point, cyclic, chaotic or random (stochastic). Attractor networks have largely been used in computational neuroscience to model neuronal processes such as associative memory and motor behavior, as well as in biologically inspired methods of machine learning. An attractor network contains a set of n nodes, which can be represented as vectors in a d-dimensional space where n>d. Over time, the network state tends toward one of a set of predefined states on a d-manifold; these are the attractors.

In epidemiology, the next-generation matrix is a method used to derive the basic reproduction number, for a compartmental model of the spread of infectious diseases. This method is given by Diekmann et al. (1990) and van den Driessche and Watmough (2002). To calculate the basic reproduction number by using a next-generation matrix, the whole population is divided into compartments in which there are infected compartments. Let be the numbers of infected individuals in the infected compartment at time t. Now, the epidemic model is

Denoising Algorithm based on Relevance network Topology (DART) is an unsupervised algorithm that estimates an activity score for a pathway in a gene expression matrix, following a denoising step. In DART, a weighted average is used where the weights reflect the degree of the nodes in the pruned network. The denoising step removes prior information that is inconsistent with a data set. This strategy substantially improves unsupervised predictions of pathway activity that are based on a prior model, which was learned from a different biological system or context.

Promoter activity

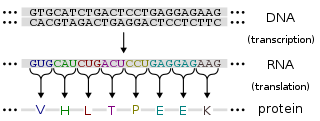
Promoter activity is a term that encompasses several meanings around the process of gene expression from regulatory sequences —promoters and enhancers. Gene expression has been commonly characterized as a measure of how much, how fast, when and where this process happens. Promoters and enhancers are required for controlling where and when a specific genes is transcribed.

References

  1. Wagner A (1996). "Does Evolutionary Plasticity Evolve?", Evolution, 50(3):1008-1023.
  2. 1 2 Bergman A and Siegal ML (2003). "Evolutionary capacitance as a general feature of complex gene networks", Nature, 424(6948):549-552.
  3. 1 2 Azevedo RBR, Lohaus R and Srinivasan S and Dang KK and Burch CL (2006). "Sexual reproduction selects for robustness and negative epistasis in artificial gene networks", Nature, 440(7080):87-90.
  4. 1 2 Huerta-Sanchez E, Durrett R (2007). "Wagner's canalization model", Theoretical Population Biology, 71(2):121-130.