2001 Canadian census

Last updated
2001 Canadian census

  1996 May 15, 2001 2006  

Statistics Canada logo.svg
General information
CountryCanada
Results
Total population30,007,094 (Increase2.svg 4.0%)
Most populous province/territory Ontario (11,410,046)
Least populous province/territory Nunavut (26,745)

The 2001 Canadian census was a detailed enumeration of the Canadian population. Census day was May 15, 2001. On that day, Statistics Canada attempted to count every person in Canada. The total population count of Canada was 30,007,094. [1] This was a 4% increase over 1996 census of 28,846,761. In contrast, the official Statistics Canada population estimate for 2001 was 31,021,300. This is considered a more accurate population number than the actual count. [2]

Contents

The previous census was the 1996 census and the following census was in 2006 census.

Canada by the numbers

A summary of information about Canada.

Total population30,007,094
Dwellings12,548,588
Men14,706,850
Women15,300,245
Median age37.6 years
Average earnings$31,757

Census summary

Canada has experienced one of the smallest census-to-census growth rates in its population. From 1996 to 2001, the nation's population increased only 4.0%. The census counted 30,007,094 people on May 15, 2001, compared with 28,846,761 on May 14, 1996.

Only three provinces and one territory had growth rates above the national average. Alberta's population soared 10.3%, Ontario gained 6.1% and British Columbia, 4.9%. Nunavut's population rose 8.1%. The population of Newfoundland and Labrador declined for the second consecutive census period.

Urbanization continued. In 2001, 79.4% of Canadians lived in an urban centre of 10,000 people or more, compared with 78.5% in 1996. Outside the urban centres, the population of rural and small-town areas declined 0.4%.

In 2001, just over 64% of the nation's population, or about 19,297,000 people, lived in the 27 census metropolitan areas (CMAs), up slightly from 63% in 1996. Seven of these 27 CMAs saw their populations grow at a rate of at least double the national average. The strongest rise, by far, occurred in Calgary.

From 1996 to 2001, the nation's population concentrated further in four broad urban regions: the extended Golden Horseshoe in southern Ontario; Montreal and environs; British Columbia's Lower Mainland and southern Vancouver Island; and the Calgary-Edmonton corridor. In 2001, 51% of Canada's population lived in these regions, compared with 49% in 1996.

Population by province/territory

RankProvince or territoryPopulation as of
2001 census
Population as of
1996 census
ChangePercent
change
1Flag of Ontario.svg  Ontario 11,410,04610,753,573656,473 Increase2.svg6.1 Increase2.svg
2Flag of Quebec.svg  Quebec 7,237,4797,138,79598,684 Increase2.svg1.4 Increase2.svg
3Flag of British Columbia.svg  British Columbia 3,907,7383,724,500183,238 Increase2.svg4.9 Increase2.svg
4Flag of Alberta.svg  Alberta 2,974,8072,696,826277,981 Increase2.svg10.3 Increase2.svg
5Flag of Manitoba.svg  Manitoba 1,119,5831,113,8985,685 Increase2.svg0.5 Increase2.svg
6Flag of Saskatchewan.svg  Saskatchewan 978,933990,237-2,318 Decrease2.svg-1.1 Decrease2.svg
7Flag of Nova Scotia.svg  Nova Scotia 908,007909,282-1,275 Decrease2.svg-0.1 Decrease2.svg
8Flag of New Brunswick.svg  New Brunswick 729,498738,133-8,635 Decrease2.svg-1.2 Decrease2.svg
9Flag of Newfoundland and Labrador.svg  Newfoundland and Labrador 512,930551,792-38,862 Decrease2.svg-7.0 Decrease2.svg
10Flag of Prince Edward Island.svg  Prince Edward Island 135,294134,557737 Increase2.svg0.5 Increase2.svg
11Flag of the Northwest Territories.svg  Northwest Territories 37,36039,672 [3] -2,312 Decrease2.svg-5.8 Decrease2.svg
12Flag of Yukon.svg  Yukon 28,67430,766-2,092 Decrease2.svg-6.8 Decrease2.svg
13Flag of Nunavut.svg  Nunavut 26,74524,730 [4] 2,015 Increase2.svg8.1 Increase2.svg
Flag of Canada (Pantone).svg  Canada 30,007,09428,846,7611,160,333 Increase2.svg4.0 Increase2.svg

Demographics

Mother tongue

Population by mother tongue of Canada's official languages:

Mother tonguePopulation
English 17,572,170
French 6,741,955
Bilingual 122,660
Other5,202,240

Aboriginal peoples

Population of Aboriginal peoples in Canada:

Aboriginal Population976,305
North American Indian 608,850
Métis 292,305
Inuit 45,070

Ethnic origin

Population by ethnic origin. Only those origins with more than 250,000 respondents are included here. This is based entirely on self reporting.

Ethnic originsTotal responsesSingle responsesMultiple responses 2
Total population29,639,03518,307,54011,331,490
Canadian 11,682,6806,748,1354,934,550
English 5,978,8751,479,5204,499,355
French 4,668,4101,060,7553,607,655
Scottish 4,157,210607,2353,549,975
Irish 3,822,660496,8653,325,800
German 2,742,765705,5952,037,170
Italian 1,270,370726,275544,090
Chinese 1,094,700936,210158,490
Ukrainian 1,071,060326,200744,860
North American Indian 1,000,890455,805545,085
Dutch (Netherlands)923,310316,220607,090
Polish 817,085260,415556,670
African 731,044UnknownUnknown
East Indian 713,330581,665131,665
Norwegian 363,76047,230316,530
Portuguese 357,690252,835104,855
Welsh 350,36528,445321,925
Jewish 348,605186,475162,130
Russian 337,96070,890267,070
Filipino 327,545266,14061,410
Métis 307,84572,210235,635
Swedish 282,76030,440252,320
Hungarian (Magyar)267,25591,795175,460
American (USA)250,01025,200224,805

Religion

Population by religion. Only those religions with more than 250,000 respondents are included here. The census question was partly aided—that is, the questionnaire form gave examples of some of the denominations but not others. The actual question asked is noted below.

ReligionTotal responses % of Population
Roman Catholic 12,793,12543.2
No religion4,796,32516.2
United Church 2,839,1259.6
Anglican 2,035,5006.9
Christian n.i.e. [5] 780,4502.6
Baptist 729,4702.5
Lutheran 606,5902.0
Muslim 579,6402.0
Protestant n.i.e. [5] 549,2051.9
Presbyterian 409,8301.4
Pentecostal 369,4751.2
Jewish 329,9951.1
Buddhist 300,3451.0
Hindu 297,2001.0
Sikh 278,4100.9
Jediism 21,0000.1

The actual question asked: "What is this person's religion? Indicate a specific denomination or religion even if this person is not currently a practising member of that group.

For example, Roman Catholic, Ukrainian Catholic, United Church, Anglican, Lutheran, Baptist, Coptic Orthodox, Greek Orthodox, Jewish, Islam, Buddhist, Hindu, Sikh, etc."

Visible minorities

Visible minorityTotal responses % of Population
Chinese 1,029,3953.47
South Asian 917,0703.09
Black 662,2152.23
Filipino 308,5751.04
Others1,066,5903.60
Not a visible
minority
25,655,18586.56

Age

Population by age:

AgePopulation
0–4 years1,696,285
5–14 years4,029,255
15–19 years2,053,325
20–24 years1,955,810
25–44 years9,096,560
45–54 years4,419,290
55–64 years2,868,015
65–74 years2,142,835
75–84 years1,329,810
85 years and over415,910

Methodology

Every person was legally required to return the census questionnaire that required answering basic demographic information. In addition randomly selected people were legally required to complete a much more detailed questionnaire.

On May 15, 2001, Statistics Canada had thousands of canvassers who went around to try to ensure that the entire population was counted. For the first time, this included canvassers who went to homeless shelters to ensure that the homeless were included in the census.

In addition to a small number of individuals who refused to participate, some first nation communities refused to participate en masse and therefore some of the statistics are inaccurate. This is noted as footnotes in many of the affected results.

Effects of the census

The census numbers are the basis of the federal governments transfer payments to the provinces and therefore when a province loses population, its transfer payments are decreased.

In addition, the census numbers are one of the elements that Elections Canada uses to create the boundaries of federal ridings.

See also

Related Research Articles

<span class="mw-page-title-main">Demographics of Canada</span>

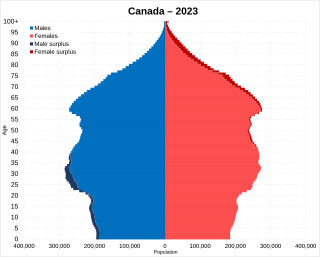
Statistics Canada conducts a country-wide census that collects demographic data every five years on the first and sixth year of each decade. The 2021 Canadian census enumerated a total population of 36,991,981, an increase of around 5.2 percent over the 2016 figure, Between 2011 and May 2016, Canada's population grew by 1.7 million people, with immigrants accounting for two-thirds of the increase. Between 1990 and 2008, the population increased by 5.6 million, equivalent to 20.4 percent overall growth. The main driver of population growth is immigration, and to a lesser extent, natural growth.

<span class="mw-page-title-main">Ethnic origins of people in Canada</span>

According to the 2021 Canadian census, over 450 "ethnic or cultural origins" were self-reported by Canadians. The major panethnic origin groups in Canada are: European (52.5%), North American (22.9%), Asian (19.3%), North American Indigenous (6.1%), African (3.8%), Latin, Central and South American (2.5%), Caribbean (2.1%), Oceanian (0.3%), and Other (6%). Statistics Canada reports that 35.5% of the population reported multiple ethnic origins, thus the overall total is greater than 100%.

<span class="mw-page-title-main">Calgary Metropolitan Region</span> Metropolitan area in Alberta, Canada

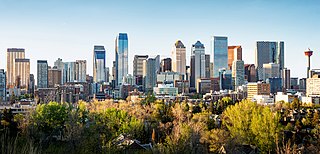
The Calgary Metropolitan Region (CMR), also commonly referred to as the Calgary Region, is a conglomeration of municipalities centred on Calgary, the largest city in Alberta.

A visible minority is defined by the Government of Canada as "persons, other than aboriginal peoples, who are non-Caucasian in race or non-white in colour". The term is used primarily as a demographic category by Statistics Canada, in connection with that country's Employment Equity policies. The qualifier "visible" was chosen by the Canadian authorities as a way to single out newer immigrant minorities from both Aboriginal Canadians and other "older" minorities distinguishable by language and religion, which are "invisible" traits.

<span class="mw-page-title-main">Calgary–Edmonton Corridor</span> Geographic region in Alberta, Canada

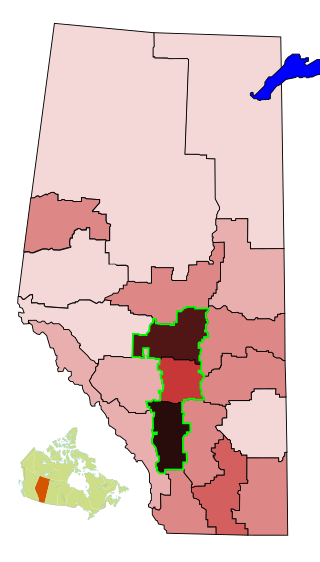
The Calgary–Edmonton Corridor is a geographical region of the Canadian province of Alberta. It is the most urbanized area in Alberta and is one of Canada's four most populated urban regions. It consists of Statistics Canada Alberta census divisions No. 11, No. 8, and No. 6. Measured from north to south, the region covers a distance of approximately 400 km (250 mi). As of the designations in the Canada 2021 Census of census metropolitan areas (CMAs) and census agglomerations (CAs) in Alberta, the corridor includes three of the province's four CMAs and two CAs, in addition to four other CAs already included in the Calgary and Edmonton CMAs.

<span class="mw-page-title-main">Edmonton Metropolitan Region</span> Metropolitan area in Canada, Alberta

The Edmonton Metropolitan Region (EMR), also commonly referred to as Greater Edmonton or Metro Edmonton, is a conglomeration of municipalities centred on Alberta's provincial capital of Edmonton.

<span class="mw-page-title-main">2006 Canadian census</span> Censuses in Canada

The 2006 Canadian census was a detailed enumeration of the Canadian population. Census day was May 16, 2006. The following census was the 2011 census. Canada's total population enumerated by the 2006 census was 31,612,897. This count was lower than the official July 1, 2006 population estimate of 32,623,490 people. The previous census was the 2001 census and the following census was in 2011 census.

<span class="mw-page-title-main">2001 South African census</span>

The National Census of 2001 was the 2nd comprehensive national census of the Republic of South Africa, or Post-Apartheid South Africa. It undertook to enumerate every person present in South Africa on the census night between 9–10 October 2001 at a cost of R 987,000,000.

The demographics of Metro Vancouver indicate a multicultural and multiracial region. Metro Vancouver is a metropolitan area, with its major urban centre being Vancouver, British Columbia, Canada. The Vancouver census metropolitan area, as defined by Statistics Canada, encompasses roughly the same territory as the Metro Vancouver Regional District, a regional district in British Columbia. The regional district includes 23 local authorities. Figures provided here are for the Vancouver census metropolitan area and not for the City of Vancouver.

Statistics Canada conducts a national census of population and census of agriculture every five years and releases the data with a two-year lag.

<span class="mw-page-title-main">Demographics of Ontario</span>

Ontario, one of the 13 provinces and territories of Canada, is located in east-central Canada. It is Canada's most populous province by a large margin, accounting for nearly 40 per cent of all Canadians, and is the second-largest province in total area. Ontario is fourth-largest in total area when the territories of the Northwest Territories and Nunavut are included. It is home to the nation's capital city, Ottawa, and the nation's most populous city, Toronto.

<span class="mw-page-title-main">Demographics of Alberta</span>

Alberta has experienced a relatively high rate of growth in recent years, due in large part to its economy. Between 2003 and 2004, the province saw high birthrates, relatively high immigration, and a high rate of interprovincial migration when compared to other provinces. Approximately 81% of the population live in urban areas and only about 19% live in rural areas. The Calgary–Edmonton Corridor is the most urbanized area in Alberta and is one of Canada's four most urban regions. Many of Alberta's cities and towns have also experienced high rates of growth in recent history. From a population of 73,022 in 1901, Alberta has grown to 3,645,257 in 2011 and in the process has gone from less than 1.5% of Canada's population to 10.9%. As of July 1, 2018, Alberta's population represented 11.6% of Canada's total population of 37,058,856 making it the fourth most populated province in Canada. According to the 2018 third quarter report, Alberta's population increased by 23,096 to 4,330,206, the largest increase since the 2014 economic downturn.

<span class="mw-page-title-main">Demographics of Manitoba</span>

Manitoba is one of Canada's 10 provinces. It is the easternmost of the three Prairie provinces.

<span class="mw-page-title-main">Demographics of Newfoundland and Labrador</span>

Newfoundland and Labrador is a province of Canada on the country's Atlantic coast in northeastern North America. The province has an area of 405,212 square kilometres and a population in 2023 of 533,710, with approximately 95% of the provincial population residing on the Island of Newfoundland, with more than half of the population residing on the Avalon Peninsula. People from Newfoundland and Labrador are called "Newfoundlanders," "Labradorians", or "Newfoundlanders and Labradorians".

The 1996 Canadian census was a detailed enumeration of the Canadian population. Census day was May 14, 1996. On that day, Statistics Canada attempted to count every person in Canada. The total population count of Canada was 28,846,761. This was a 5.7% increase over the 1991 census of 27,296,859.

According to the 2021 census, the City of Edmonton had a population of 1,010,899 residents, compared to 4,262,635 for all of Alberta, Canada. The total population of the Edmonton census metropolitan area (CMA) was 1,418,118, making it the sixth-largest CMA in Canada.

<span class="mw-page-title-main">Demographics of Calgary</span>

In the 2021 Census, the City of Calgary had a population of 1,306,784 residents, representing 30.7% of the 4,262,635 residents in all of Alberta, and 3.5% compared to a population of 36,991,981 in all of Canada. The total population of the Calgary census metropolitan area (CMA) was 1,481,806. Calgary is the largest city in Alberta, and the third-largest municipality and fifth-largest metropolitan area in Canada, as of 2021.

The census in Malaysia, or officially, the Population and Housing Census, is a descriptive count of everyone who is in Malaysia on the Census Day, and of their dwellings. The decennial Malaysian census has been conducted six times, As of 2010. It has been conducted every 10 years, beginning in 1960.

References

  1. "2001 Census facts: did you know..." (PDF). Statistics Canada. 2006. Archived from the original (pdf) on 2011-07-06. Retrieved 2010-06-24.
  2. "Population estimates". Statistics Canada. 2006. Retrieved 2010-06-24.
  3. Adjusted figure due to boundary change
  4. Adjusted figure due to boundary change
  5. 1 2 not included elsewhere