
The Gall–Peters projection is a rectangular, equal-area map projection. Like all equal-area projections, it distorts most shapes. It is a cylindrical equal-area projection with latitudes 45° north and south as the regions on the map that have no distortion.

In geography, latitude is a coordinate that specifies the north–south position of a point on the surface of the Earth or another celestial body. Latitude is given as an angle that ranges from –90° at the south pole to 90° at the north pole, with 0° at the Equator. Lines of constant latitude, or parallels, run east–west as circles parallel to the equator. Latitude and longitude are used together as a coordinate pair to specify a location on the surface of the Earth.

A map is a symbolic depiction emphasizing relationships between elements of some space, such as objects, regions, or themes.

The Mercator projection is a cylindrical map projection presented by Flemish geographer and cartographer Gerardus Mercator in 1569. It became the standard map projection for navigation because it is unique in representing north as up and south as down everywhere while preserving local directions and shapes. The map is thereby conformal. As a side effect, the Mercator projection inflates the size of objects away from the equator. This inflation is very small near the equator but accelerates with increasing latitude to become infinite at the poles. As a result, landmasses such as Greenland, Antarctica, Canada and Russia appear far larger than they actually are relative to landmasses near the equator, such as Central Africa.

A sphere is a geometrical object that is a three-dimensional analogue to a two-dimensional circle. Formally, a sphere is the set of points that are all at the same distance r from a given point in three-dimensional space. That given point is the centre of the sphere, and r is the sphere's radius. The earliest known mentions of spheres appear in the work of the ancient Greek mathematicians.
In cartography, a map projection is any of a broad set of transformations employed to represent the curved two-dimensional surface of a globe on a plane. In a map projection, coordinates, often expressed as latitude and longitude, of locations from the surface of the globe are transformed to coordinates on a plane. Projection is a necessary step in creating a two-dimensional map and is one of the essential elements of cartography.

In mathematics, a stereographic projection is a perspective projection of the sphere, through a specific point on the sphere, onto a plane perpendicular to the diameter through the point. It is a smooth, bijective function from the entire sphere except the center of projection to the entire plane. It maps circles on the sphere to circles or lines on the plane, and is conformal, meaning that it preserves angles at which curves meet and thus locally approximately preserves shapes. It is neither isometric nor equiareal.

The Dymaxion map or Fuller map is a projection of a world map onto the surface of an icosahedron, which can be unfolded and flattened to two dimensions. The flat map is heavily interrupted in order to preserve shapes and sizes.

The Robinson projection is a map projection of a world map that shows the entire world at once. It was specifically created in an attempt to find a good compromise to the problem of readily showing the whole globe as a flat image.
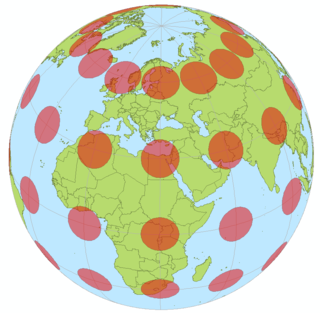
Nicolas Auguste Tissot was a French cartographer, who in 1859 and 1881 published an analysis of the distortion that occurs on map projections. He devised Tissot's indicatrix, or distortion circle, which when plotted on a map will appear as an ellipse whose elongation depends on the amount of distortion by the map at that point. The angle and extent of the elongation represents the amount of angular distortion of the map. The size of the ellipse indicates the amount that the area is distorted.

The scale of a map is the ratio of a distance on the map to the corresponding distance on the ground. This simple concept is complicated by the curvature of the Earth's surface, which forces scale to vary across a map. Because of this variation, the concept of scale becomes meaningful in two distinct ways.

The equirectangular projection, and which includes the special case of the plate carrée projection, is a simple map projection attributed to Marinus of Tyre, who Ptolemy claims invented the projection about AD 100.
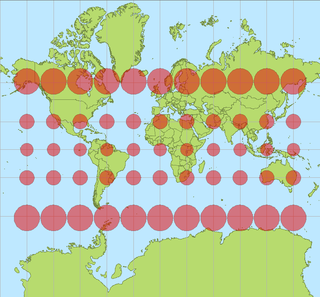
In cartography, a Tissot's indicatrix is a mathematical contrivance presented by French mathematician Nicolas Auguste Tissot in 1859 and 1871 in order to characterize local distortions due to map projection. It is the geometry that results from projecting a circle of infinitesimal radius from a curved geometric model, such as a globe, onto a map. Tissot proved that the resulting diagram is an ellipse whose axes indicate the two principal directions along which scale is maximal and minimal at that point on the map.

The Lambert azimuthal equal-area projection is a particular mapping from a sphere to a disk. It accurately represents area in all regions of the sphere, but it does not accurately represent angles. It is named for the Swiss mathematician Johann Heinrich Lambert, who announced it in 1772. "Zenithal" being synonymous with "azimuthal", the projection is also known as the Lambert zenithal equal-area projection.
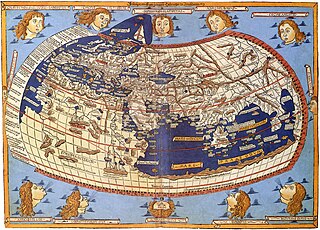
The history of cartography refers to the development and consequences of cartography, or mapmaking technology, throughout human history. Maps have been one of the most important human inventions for millennia, allowing humans to explain and navigate their way through the world.

The two-point equidistant projection or doubly equidistant projection is a map projection first described by Hans Maurer in 1919 and Charles Close in 1921. It is a generalization of the much simpler azimuthal equidistant projection. In this two-point form, two locus points are chosen by the mapmaker to configure the projection. Distances from the two loci to any other point on the map are correct: that is, they scale to the distances of the same points on the sphere.
In cartography, a conformal map projection is one in which every angle between two curves that cross each other on Earth is preserved in the image of the projection; that is, the projection is a conformal map in the mathematical sense. For example, if two roads cross each other at a 39° angle, their images on a map with a conformal projection cross at a 39° angle.

The stereographic projection, also known as the planisphere projection or the azimuthal conformal projection, is a conformal map projection whose use dates back to antiquity. Like the orthographic projection and gnomonic projection, the stereographic projection is an azimuthal projection, and when on a sphere, also a perspective projection.
A polyhedral map projection is a map projection based on a spherical polyhedron. Typically, the polyhedron is overlaid on the globe, and each face of the polyhedron is transformed to a polygon or other shape in the plane. The best-known polyhedral map projection is Buckminster Fuller's Dymaxion map. When the spherical polyhedron faces are transformed to the faces of an ordinary polyhedron instead of laid flat in a plane, the result is a polyhedral globe.
