Polyconic projection class

Last updated
American polyconic projection of the world American Polyconic projection.jpg
American polyconic projection of the world
Van der Grinten projection of the world. Van der Grinten projection SW.jpg
Van der Grinten projection of the world.

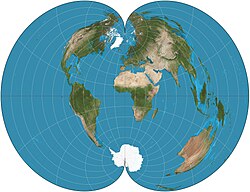
Polyconic can refer either to a class of map projections or to a specific projection known less ambiguously as the American polyconic projection. Polyconic as a class refers to those projections whose parallels are all non-concentric circular arcs, except for a straight equator, and the centers of these circles lie along a central axis. This description applies to projections in equatorial aspect. [1]

Contents

Polyconic projections

Some of the projections that fall into the polyconic class are:

A series of polyconic projections, each in a circle, was also presented by Hans Mauer in 1922, [3] who also presented an equal-area polyconic in 1935. [4] :248 Another series by Georgiy Aleksandrovich Ginzburg appeared starting in 1949. [4] :258–262

Most polyconic projections, when used to map the entire sphere, produce an "apple-shaped" map of the world. There are many "apple-shaped" projections, almost all of them obscure. [2]

See also

Related Research Articles

<span class="mw-page-title-main">Mercator projection</span> Cylindrical conformal map projection

The Mercator projection is a cylindrical map projection presented by Flemish geographer and cartographer Gerardus Mercator in 1569. It became the standard map projection for navigation because it is unique in representing north as up and south as down everywhere while preserving local directions and shapes. The map is thereby conformal. As a side effect, the Mercator projection inflates the size of objects away from the equator. This inflation is very small near the equator but accelerates with increasing latitude to become infinite at the poles. As a result, landmasses such as Greenland, Antarctica and Russia appear far larger than they actually are relative to landmasses near the equator, such as Central Africa.

<span class="mw-page-title-main">Map projection</span> Systematic representation of the surface of a sphere or ellipsoid onto a plane

In cartography, map projection is the term used to describe a broad set of transformations employed to represent the two-dimensional curved surface of a globe on a plane. In a map projection, coordinates, often expressed as latitude and longitude, of locations from the surface of the globe are transformed to coordinates on a plane. Projection is a necessary step in creating a two-dimensional map and is one of the essential elements of cartography.

<span class="mw-page-title-main">Stereographic projection</span> Particular mapping that projects a sphere onto a plane

In mathematics, a stereographic projection is a perspective projection of the sphere, through a specific point on the sphere, onto a plane perpendicular to the diameter through the point. It is a smooth, bijective function from the entire sphere except the center of projection to the entire plane. It maps circles on the sphere to circles or lines on the plane, and is conformal, meaning that it preserves angles at which curves meet and thus locally approximately preserves shapes. It is neither isometric nor equiareal.

<span class="mw-page-title-main">Robinson projection</span> Pseudocylindrical compromise map projection

The Robinson projection is a map projection of a world map which shows the entire world at once. It was specifically created in an attempt to find a good compromise to the problem of readily showing the whole globe as a flat image.

<span class="mw-page-title-main">Azimuthal equidistant projection</span> Azimuthal equidistant map projection

The azimuthal equidistant projection is an azimuthal map projection. It has the useful properties that all points on the map are at proportionally correct distances from the center point, and that all points on the map are at the correct azimuth (direction) from the center point. A useful application for this type of projection is a polar projection which shows all meridians as straight, with distances from the pole represented correctly. The flag of the United Nations contains an example of a polar azimuthal equidistant projection.

<span class="mw-page-title-main">Scale (map)</span> Ratio of distance on a map to the corresponding distance on the ground

The scale of a map is the ratio of a distance on the map to the corresponding distance on the ground. This simple concept is complicated by the curvature of the Earth's surface, which forces scale to vary across a map. Because of this variation, the concept of scale becomes meaningful in two distinct ways.

<span class="mw-page-title-main">Equirectangular projection</span> Cylindrical equidistant map projection

The equirectangular projection, and which includes the special case of the plate carrée projection, is a simple map projection attributed to Marinus of Tyre, who Ptolemy claims invented the projection about AD 100. The projection maps meridians to vertical straight lines of constant spacing, and circles of latitude to horizontal straight lines of constant spacing. The projection is neither equal area nor conformal. Because of the distortions introduced by this projection, it has little use in navigation or cadastral mapping and finds its main use in thematic mapping. In particular, the plate carrée has become a standard for global raster datasets, such as Celestia, NASA World Wind, the USGS Astrogeology Research Program, and Natural Earth, because of the particularly simple relationship between the position of an image pixel on the map and its corresponding geographic location on Earth or other spherical solar system bodies. In addition it is frequently used in panoramic photography to represent a spherical panoramic image.

<span class="mw-page-title-main">Werner projection</span>

The Werner projection is a pseudoconic equal-area map projection sometimes called the Stab-Werner or Stabius-Werner projection. Like other heart-shaped projections, it is also categorized as cordiform. Stab-Werner refers to two originators: Johannes Werner (1466–1528), a parish priest in Nuremberg, refined and promoted this projection that had been developed earlier by Johannes Stabius (Stab) of Vienna around 1500.

<span class="mw-page-title-main">Bonne projection</span>

The Bonne projection is a pseudoconical equal-area map projection, sometimes called a dépôt de la guerre, modified Flamsteed, or a Sylvanus projection. Although named after Rigobert Bonne (1727–1795), the projection was in use prior to his birth, in 1511 by Sylvanus, Honter in 1561, De l'Isle before 1700 and Coronelli in 1696. Both Sylvanus and Honter's usages were approximate, however, and it is not clear they intended to be the same projection.

<span class="mw-page-title-main">Van der Grinten projection</span> Compromise map projection

The van der Grinten projection is a compromise map projection, which means that it is neither equal-area nor conformal. Unlike perspective projections, the van der Grinten projection is an arbitrary geometric construction on the plane. Van der Grinten projects the entire Earth into a circle. It largely preserves the familiar shapes of the Mercator projection while modestly reducing Mercator's distortion. Polar regions are subject to extreme distortion. Lines of longitude converge to points at the poles.

<span class="mw-page-title-main">Hammer projection</span> Pseudoazimuthal equal-area map projection

The Hammer projection is an equal-area map projection described by Ernst Hammer in 1892. Using the same 2:1 elliptical outer shape as the Mollweide projection, Hammer intended to reduce distortion in the regions of the outer meridians, where it is extreme in the Mollweide.

In cartography, a conformal map projection is one in which every angle between two curves that cross each other on Earth is preserved in the image of the projection, i.e. the projection is a conformal map in the mathematical sense. For example, if two roads cross each other at a 39° angle, then their images on a map with a conformal projection cross at a 39° angle.

<span class="mw-page-title-main">Cylindrical equal-area projection</span> Family of map projections

In cartography, the normal cylindrical equal-area projection is a family of normal cylindrical, equal-area map projections.

<span class="mw-page-title-main">Eckert II projection</span> Pseudocylindrical equal-area map projection

The Eckert II projection is an equal-area pseudocylindrical map projection. In the equatorial aspect the network of longitude and latitude lines consists solely of straight lines, and the outer boundary has the distinctive shape of an elongated hexagon. It was first described by Max Eckert in 1906 as one of a series of three pairs of pseudocylindrical projections. Within each pair, the meridians have the same shape, and the odd-numbered projection has equally spaced parallels, whereas the even-numbered projection has parallels spaced to preserve area. The pair to Eckert II is the Eckert I projection.

<span class="mw-page-title-main">Loximuthal projection</span> Pseudocylindrical compromise map projection

In cartography, the loximuthal projection is a map projection introduced by Karl Siemon in 1935, and independently in 1966 by Waldo R. Tobler, who named it. It is characterized by the fact that loxodromes from one chosen central point are shown straight lines, correct in azimuth from the center, and are "true to scale" in the sense that distances measured along such lines are proportional to lengths of the corresponding rhumb lines on the surface of the earth. It is neither an equal-area projection nor conformal.

The latitudinally equal-differential polyconic projection is a polyconic map projection in use since 1963 in mainland China. Maps on this projection are produced by China's State Bureau of Surveying and Mapping and other publishers. Its original method of construction has not been preserved, but a mathematical approximation has been published.

<span class="mw-page-title-main">American polyconic projection</span> Pseudoconical compromise map projection

The American polyconic map projection is a map projection used for maps of the United States and regions of the United States beginning early in the 19th century. It belongs to the polyconic projection class, which consists of map projections whose parallels are non-concentric circular arcs except for the equator, which is straight. Often the American polyconic is simply called the polyconic projection.

<span class="mw-page-title-main">Rectangular polyconic projection</span> Pseudoconical compromise map projection

The rectangular polyconic projection is a map projection was first mentioned in 1853 by the U.S. Coast Survey, where it was developed and used for portions of the U.S. exceeding about one square degree. It belongs to the polyconic projection class, which consists of map projections whose parallels are non-concentric circular arcs except for the equator, which is straight. Sometimes the rectangular polyconic is called the War Office projection due to its use by the British War Office for topographic maps. It is not used much these days, with practically all military grid systems having moved onto conformal projection systems, typically modeled on the transverse Mercator projection.

<span class="mw-page-title-main">Nicolosi globular projection</span>

The Nicolosi globular projection is a polyconic map projection invented about the year 1,000 by the Iranian polymath al-Biruni. As a circular representation of a hemisphere, it is called globular because it evokes a globe. It can only display one hemisphere at a time and so normally appears as a "double hemispheric" presentation in world maps. The projection came into use in the Western world starting in 1660, reaching its most common use in the 19th century. As a "compromise" projection, it preserves no particular properties, instead giving a balance of distortions.

References

  1. An Album of Map Projections (US Geological Survey Professional Paper 1453), John P. Snyder & Philip M. Voxland, 1989, p. 4.
  2. 1 2 John J. G. Savard. "The Dietrich-Kitada Projection".
  3. https://pubs.usgs.gov/pp/1453/report.pdf [ bare URL PDF ]
  4. 1 2 John P. Snyder (1993). Flattening the Earth: Two Thousand Years of Map Projections. ISBN   0-226-76747-7.