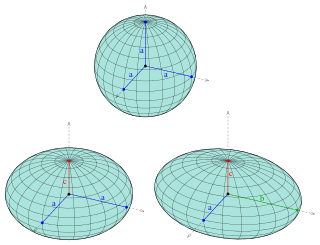
Orthographic map projection

Last updated
Orthographic projection (equatorial aspect) of eastern hemisphere 30W-150E Orthographic projection SW.jpg
Orthographic projection (equatorial aspect) of eastern hemisphere 30W150E
The orthographic projection with Tissot's indicatrix of deformation. Orthographic with Tissot's Indicatrices of Distortion.svg
The orthographic projection with Tissot's indicatrix of deformation.

Orthographic projection in cartography has been used since antiquity. Like the stereographic projection and gnomonic projection, orthographic projection is a perspective (or azimuthal) projection in which the sphere is projected onto a tangent plane or secant plane. The point of perspective for the orthographic projection is at infinite distance. It depicts a hemisphere of the globe as it appears from outer space, where the horizon is a great circle. The shapes and areas are distorted, particularly near the edges. [1] [2]

Contents

History

The orthographic projection has been known since antiquity, with its cartographic uses being well documented. Hipparchus used the projection in the 2nd century BC to determine the places of star-rise and star-set. In about 14 BC, Roman engineer Marcus Vitruvius Pollio used the projection to construct sundials and to compute sun positions. [2]

Vitruvius also seems to have devised the term orthographic (from the Greek orthos (= “straight”) and graphē (= “drawing”)) for the projection. However, the name analemma , which also meant a sundial showing latitude and longitude, was the common name until François d'Aguilon of Antwerp promoted its present name in 1613. [2]

The earliest surviving maps on the projection appear as crude woodcut drawings of terrestrial globes of 1509 (anonymous), 1533 and 1551 (Johannes Schöner), and 1524 and 1551 (Apian). A highly-refined map, designed by Renaissance polymath Albrecht Dürer and executed by Johannes Stabius, appeared in 1515. [2]

Photographs of the Earth and other planets from spacecraft have inspired renewed interest in the orthographic projection in astronomy and planetary science.

Mathematics

The formulas for the spherical orthographic projection are derived using trigonometry. They are written in terms of longitude (λ) and latitude (φ) on the sphere. Define the radius of the sphere R and the center point (and origin) of the projection (λ0, φ0). The equations for the orthographic projection onto the (x, y) tangent plane reduce to the following: [1]

Latitudes beyond the range of the map should be clipped by calculating the angular distance c from the center of the orthographic projection. This ensures that points on the opposite hemisphere are not plotted:

.

The point should be clipped from the map if cos(c) is negative. That is, all points that are included in the mapping satisfy:

.

The inverse formulas are given by:

where

For computation of the inverse formulas the use of the two-argument atan2 form of the inverse tangent function (as opposed to atan) is recommended. This ensures that the sign of the orthographic projection as written is correct in all quadrants.

The inverse formulas are particularly useful when trying to project a variable defined on a (λ, φ) grid onto a rectilinear grid in (x, y). Direct application of the orthographic projection yields scattered points in (x, y), which creates problems for plotting and numerical integration. One solution is to start from the (x, y) projection plane and construct the image from the values defined in (λ, φ) by using the inverse formulas of the orthographic projection.

See References for an ellipsoidal version of the orthographic map projection. [3]

Comparison azimuthal projections.svg
Comparison of the Orthographic map projection and some azimuthal projections centred on 90° N at the same scale, ordered by projection altitude in Earth radii. (click for detail)

Orthographic projections onto cylinders

In a wide sense, all projections with the point of perspective at infinity (and therefore parallel projecting lines) are considered as orthographic, regardless of the surface onto which they are projected. Such projections distort angles and areas close to the poles.[ clarification needed ]

An example of an orthographic projection onto a cylinder is the Lambert cylindrical equal-area projection.

See also

Related Research Articles

<span class="mw-page-title-main">Mercator projection</span> Cylindrical conformal map projection

The Mercator projection is a cylindrical map projection presented by Flemish geographer and cartographer Gerardus Mercator in 1569. It became the standard map projection for navigation because it is unique in representing north as up and south as down everywhere while preserving local directions and shapes. The map is thereby conformal. As a side effect, the Mercator projection inflates the size of objects away from the equator. This inflation is very small near the equator but accelerates with increasing latitude to become infinite at the poles. As a result, landmasses such as Greenland, Antarctica and Russia appear far larger than they actually are relative to landmasses near the equator, such as Central Africa.

<span class="mw-page-title-main">Ellipsoid</span> Quadric surface that looks like a deformed sphere

An ellipsoid is a surface that may be obtained from a sphere by deforming it by means of directional scalings, or more generally, of an affine transformation.

<span class="mw-page-title-main">Rhumb line</span> Arc crossing all meridians of longitude at the same angle

In navigation, a rhumb line, rhumb, or loxodrome is an arc crossing all meridians of longitude at the same angle, that is, a path with constant bearing as measured relative to true north.

<span class="mw-page-title-main">Transverse Mercator projection</span> Adaptation of the standard Mercator projection

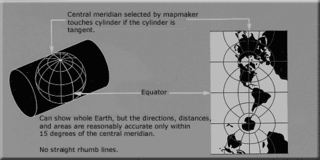
The transverse Mercator map projection is an adaptation of the standard Mercator projection. The transverse version is widely used in national and international mapping systems around the world, including the Universal Transverse Mercator. When paired with a suitable geodetic datum, the transverse Mercator delivers high accuracy in zones less than a few degrees in east-west extent.

<span class="mw-page-title-main">Mollweide projection</span> Pseudocylindrical equal-area map projection

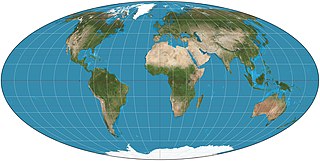
The Mollweide projection is an equal-area, pseudocylindrical map projection generally used for maps of the world or celestial sphere. It is also known as the Babinet projection, homalographic projection, homolographic projection, and elliptical projection. The projection trades accuracy of angle and shape for accuracy of proportions in area, and as such is used where that property is needed, such as maps depicting global distributions.

<span class="mw-page-title-main">Azimuthal equidistant projection</span> Azimuthal equidistant map projection

The azimuthal equidistant projection is an azimuthal map projection. It has the useful properties that all points on the map are at proportionally correct distances from the center point, and that all points on the map are at the correct azimuth (direction) from the center point. A useful application for this type of projection is a polar projection which shows all meridians as straight, with distances from the pole represented correctly. The flag of the United Nations contains an example of a polar azimuthal equidistant projection.

<span class="mw-page-title-main">Bonne projection</span>

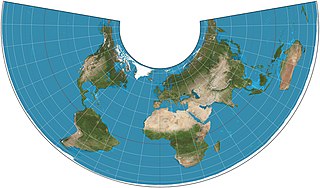
The Bonne projection is a pseudoconical equal-area map projection, sometimes called a dépôt de la guerre, modified Flamsteed, or a Sylvanus projection. Although named after Rigobert Bonne (1727–1795), the projection was in use prior to his birth, in 1511 by Sylvanus, Honter in 1561, De l'Isle before 1700 and Coronelli in 1696. Both Sylvanus and Honter's usages were approximate, however, and it is not clear they intended to be the same projection.

<span class="mw-page-title-main">Bottomley projection</span> Pseudoconical equal-area map projection

The Bottomley map projection is a pseudoconical equal area map projection defined as:

<span class="mw-page-title-main">Tissot's indicatrix</span> Characterization of distortion in map protections

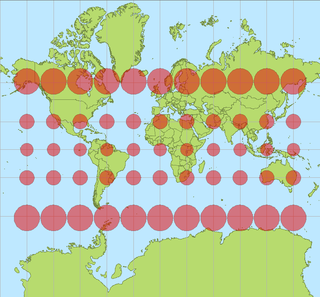
In cartography, a Tissot's indicatrix is a mathematical contrivance presented by French mathematician Nicolas Auguste Tissot in 1859 and 1871 in order to characterize local distortions due to map projection. It is the geometry that results from projecting a circle of infinitesimal radius from a curved geometric model, such as a globe, onto a map. Tissot proved that the resulting diagram is an ellipse whose axes indicate the two principal directions along which scale is maximal and minimal at that point on the map.

<span class="mw-page-title-main">Lambert conformal conic projection</span> Conic conformal map projection

A Lambert conformal conic projection (LCC) is a conic map projection used for aeronautical charts, portions of the State Plane Coordinate System, and many national and regional mapping systems. It is one of seven projections introduced by Johann Heinrich Lambert in his 1772 publication Anmerkungen und Zusätze zur Entwerfung der Land- und Himmelscharten.

<span class="mw-page-title-main">Albers projection</span> Conic equal-area map projection

The Albers equal-area conic projection, or Albers projection, is a conic, equal area map projection that uses two standard parallels. Although scale and shape are not preserved, distortion is minimal between the standard parallels.

<span class="mw-page-title-main">Hammer projection</span> Pseudoazimuthal equal-area map projection

The Hammer projection is an equal-area map projection described by Ernst Hammer in 1892. Using the same 2:1 elliptical outer shape as the Mollweide projection, Hammer intended to reduce distortion in the regions of the outer meridians, where it is extreme in the Mollweide.

<span class="mw-page-title-main">Cassini projection</span> Cylindrical equidistant map projection

The Cassini projection is a map projection described by César-François Cassini de Thury in 1745. It is the transverse aspect of the equirectangular projection, in that the globe is first rotated so the central meridian becomes the "equator", and then the normal equirectangular projection is applied. Considering the earth as a sphere, the projection is composed of the operations:
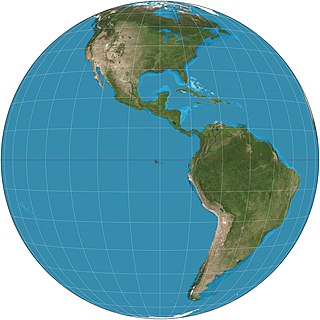
<span class="mw-page-title-main">Wagner VI projection</span> Pseudocylindrical compromise map projection

Wagner VI is a pseudocylindrical whole Earth map projection. Like the Robinson projection, it is a compromise projection, not having any special attributes other than a pleasing, low distortion appearance. Wagner VI is equivalent to the Kavrayskiy VII horizontally elongated by a factor of . This elongation results in proper preservation of shapes near the equator but slightly more distortion overall. The aspect ratio of this projection is 2:1, as formed by the ratio of the equator to the central meridian. This matches the ratio of Earth’s equator to any meridian.

<span class="mw-page-title-main">Equidistant conic projection</span> Conic equidistant map projection

The equidistant conic projection is a conic map projection commonly used for maps of small countries as well as for larger regions such as the continental United States that are elongated east-to-west.

<span class="mw-page-title-main">Eckert IV projection</span> Pseudocylindrical equal-area map projection

The Eckert IV projection is an equal-area pseudocylindrical map projection. The length of the polar lines is half that of the equator, and lines of longitude are semiellipses, or portions of ellipses. It was first described by Max Eckert in 1906 as one of a series of three pairs of pseudocylindrical projections. Within each pair, meridians are the same whereas parallels differ. Odd-numbered projections have parallels spaced equally, whereas even-numbered projections have parallels spaced to preserve area. Eckert IV is paired with Eckert III.

<span class="mw-page-title-main">Armadillo projection</span> Compromise map projection

The armadillo projection is a map projection used for world maps. It is neither conformal nor equal-area but instead affords a view evoking a perspective projection while showing most of the globe instead of the half or less that a perspective would. The projection was presented in 1943 by Erwin Raisz (1893–1968) as part of a series of "orthoapsidal" projections, which are perspectives of the globe projected onto various surfaces. This one in the series has the globe projected onto half a torus. Raisz singled it out and named it the "armadillo" projection.

<span class="mw-page-title-main">Nicolosi globular projection</span>

The Nicolosi globular projection is a polyconic map projection invented about the year 1,000 by the Iranian polymath al-Biruni. As a circular representation of a hemisphere, it is called globular because it evokes a globe. It can only display one hemisphere at a time and so normally appears as a "double hemispheric" presentation in world maps. The projection came into use in the Western world starting in 1660, reaching its most common use in the 19th century. As a "compromise" projection, it preserves no particular properties, instead giving a balance of distortions.

<span class="mw-page-title-main">Strebe 1995 projection</span> Pseudoazimuthal equal-area map projection

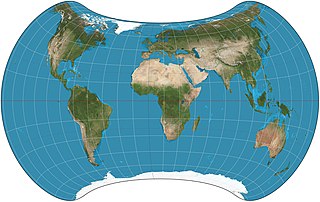
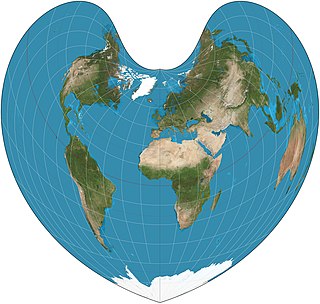
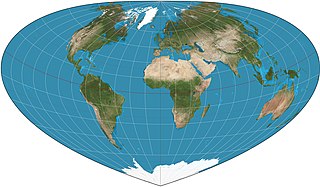
The Strebe 1995 projection, Strebe projection, Strebe lenticular equal-area projection, or Strebe equal-area polyconic projection is an equal-area map projection presented by Daniel "daan" Strebe in 1994. Strebe designed the projection to keep all areas proportionally correct in size; to push as much of the inevitable distortion as feasible away from the continental masses and into the Pacific Ocean; to keep a familiar equatorial orientation; and to do all this without slicing up the map.

The Eckert-Greifendorff projection is an equal-area map projection described by Max Eckert-Greifendorff in 1935. Unlike his previous six projections, It is not pseudocylindrical.

References

  1. 1 2 Snyder, J. P. (1987). Map Projections—A Working Manual (US Geologic Survey Professional Paper 1395). Washington, D.C.: US Government Printing Office. pp.  145–153.
  2. 1 2 3 4 Snyder, John P. (1993). Flattening the Earth: Two Thousand Years of Map Projections pp. 16–18. Chicago and London: The University of Chicago Press. ISBN   9780226767475.
  3. Zinn, Noel (June 2011). "Ellipsoidal Orthographic Projection via ECEF and Topocentric (ENU)" (PDF). Retrieved 2011-11-11.