Chesterfield | |
---|---|
Borough constituency for the House of Commons | |
County | Derbyshire |
Population | 93,248 (2011 census) [1] |
Electorate | 72,866 (December 2010) [2] |
Major settlements | Chesterfield |
Current constituency | |
Created | 1885 |
Member of Parliament | Toby Perkins (Labour) |
Seats | One |
Created from | Derbyshire East |
Chesterfield is a constituency [n 1] represented in the House of Commons of the UK Parliament since 2010 by Toby Perkins of the Labour Party. [n 2]
The seat covers Chesterfield itself and the villages to the east. 59% of residents voted to leave the EU in 2016. Residents are slightly less healthy and wealthy than the UK average. [3]
The current boundaries include the town of Chesterfield, together with areas to the north towards Dronfield and to the east towards Bolsover, comprising the Borough of Chesterfield wards: Brimington North, Brimington South, Brockwell, Dunston, Hasland, Hollingwood and Inkersall, Holmebrook, Linacre, Loundsley Green, Middlecroft and Poolsbrook, Moor, Old Whittington, Rother, St Helen's, St Leonard's, Walton, and West. [4] The other two Borough of Chesterfield wards (Barrow Hill and New Whittington; Lowgates and Woodthorpe) fall within the neighbouring North East Derbyshire seat. [4] Boundary changes before the 2010 general election, when the Mid Derbyshire constituency was created, meant that Chesterfield lost New Whittington to North East Derbyshire but otherwise retained its shape.
Further to a local government boundary review which came into effect in May 2023, [5] [6] the constituency now comprises the following wards of the Borough of Chesterfield:
Following the 2023 Periodic Review of Westminster constituencies, which came into effect for the 2024 general election, the composition of the constituency (based on the ward structure which existed on 1 December 2020) is unchanged. [8]
Chesterfield has mainly been a Labour seat, with periods when it has been held by other parties; it was gained by the Liberal Democrats in 2001 and held by them until 2010. Chesterfield was safe seat for Labour from 1935 until 2001. Andrew Cavendish, later the Duke of Devonshire, was the National Liberal candidate at the 1945 and 1950 elections.
The seat was held in succession by two prominent Labour politicians for over 35 years. The former Labour cabinet minister Eric Varley held the seat from October 1964 to January 1984, and was succeeded by his ex-government colleague Tony Benn, who held the seat following a by-election in March 1984. He remained the town's MP until his retirement from the House of Commons in 2001, when he famously remarked that his decision was taken to "spend more time on politics". Benn had been a Labour Cabinet Minister between 1966–70 and 1974–1979, while Varley was in the Wilson and Callaghan cabinets in the latter period. Paul Holmes gained the seat for the Liberal Democrats at the 2001 general election, the party's first Commons seat in the East Midlands, but were narrowly defeated at the 2010 by the Labour candidate Toby Perkins, one of only three seats the Labour Party gained at the 2010 general election. In 2015, a collapse in the Liberal Democrat vote nationwide had them fall behind to fourth place, the Conservatives move into second place, and Labour having their largest majority in the seat since 1979.
Party | Candidate | Votes | % | ±% | |
---|---|---|---|---|---|
Liberal Democrats | Ian Barfield [11] | ||||
Conservative | Ben Flook [12] | ||||
Labour | Toby Perkins [13] | ||||
Green | David Wadsworth [14] | ||||
Majority | |||||
Turnout |
Party | Candidate | Votes | % | ±% | |
---|---|---|---|---|---|
Labour | Toby Perkins | 18,171 | 40.2 | −14.6 | |
Conservative | Leigh Higgins | 16,720 | 37.0 | +2.2 | |
Brexit Party | John Scotting | 4,771 | 10.6 | New | |
Liberal Democrats | Emily Coy | 3,985 | 8.8 | +3.4 | |
Green | Neil Jackson | 1,148 | 2.5 | +0.9 | |
Independent | John Daramy | 391 | 0.9 | New | |
Majority | 1,451 | 3.2 | −16.8 | ||
Turnout | 45,186 | 63.6 | −3.3 | ||
Labour hold | Swing | −8.4 | |||
Party | Candidate | Votes | % | ±% | |
---|---|---|---|---|---|
Labour | Toby Perkins [19] | 26,266 | 54.8 | +6.9 | |
Conservative | Spencer Pitfield [19] | 16,661 | 34.8 | +16.7 | |
Liberal Democrats | Tom Snowdon [19] | 2,612 | 5.4 | −8.4 | |
UKIP | Stuart Bent [19] | 1,611 | 3.4 | −13.1 | |
Green | David Wadsworth [19] | 777 | 1.6 | −1.4 | |
Majority | 9,605 | 20.0 | −9.8 | ||
Turnout | 47,927 | 66.9 | +3.7 | ||
Labour hold | Swing | −4.9 | |||
Party | Candidate | Votes | % | ±% | |
---|---|---|---|---|---|
Labour | Toby Perkins | 21,829 | 47.9 | +8.9 | |
Conservative | Mark Vivis | 8,231 | 18.1 | +2.3 | |
UKIP | Stuart Yeowart | 7,523 | 16.5 | +13.4 | |
Liberal Democrats | Julia Cambridge | 6,301 | 13.8 | -24.0 | |
Green | Matthew Genn | 1,352 | 3.0 | +1.7 | |
TUSC | Matt Whale [21] | 202 | 0.4 | New | |
Peace | Tommy Holgate | 129 | 0.3 | New | |
Majority | 13,598 | 29.8 | +28.6 | ||
Turnout | 45,567 | 63.2 | -0.6 | ||
Labour hold | Swing | +3.3 | |||
At the 2015 general election, this seat was the 25th most marginal constituency in Great Britain, the Liberal Democrats requiring a swing from Labour of 0.6% to take the seat (based on the result of the 2010 general election). [22]
Party | Candidate | Votes | % | ±% | |
---|---|---|---|---|---|
Labour | Toby Perkins | 17,891 | 39.0 | -1.6 | |
Liberal Democrats | Paul Holmes | 17,342 | 37.8 | -9.1 | |
Conservative | Carolyn Abbott | 7,214 | 15.7 | +7.5 | |
UKIP | David Phillips | 1,432 | 3.1 | +0.9 | |
English Democrat | Ian Jerram | 1,213 | 2.6 | +0.8 | |
Green | Duncan Kerr | 600 | 1.3 | New | |
Independent | John "Noneoftheabove" Daramy | 147 | 0.3 | New | |
Majority | 549 | 1.2 | N/A | ||
Turnout | 45,839 | 63.8 | +3.8 | ||
Labour gain from Liberal Democrats | Swing | +3.8 | |||
Party | Candidate | Votes | % | ±% | |
---|---|---|---|---|---|
Liberal Democrats | Paul Holmes | 20,875 | 47.3 | -0.5 | |
Labour | Simon Rich | 17,830 | 40.4 | -1.6 | |
Conservative | Mark Kreling | 3,605 | 8.2 | +0.1 | |
UKIP | Christopher Brady | 997 | 2.3 | New | |
English Democrat | Ian Jerram | 814 | 1.8 | New | |
Majority | 3,045 | 6.9 | +1.1 | ||
Turnout | 44,121 | 59.6 | -1.1 | ||
Liberal Democrats hold | Swing | +0.6 | |||
Party | Candidate | Votes | % | ±% | |
---|---|---|---|---|---|
Liberal Democrats | Paul Holmes | 21,249 | 47.8 | +8.2 | |
Labour | Reg Race | 18,663 | 42.0 | -8.8 | |
Conservative | Simon Hitchcock | 3,613 | 8.1 | -1.1 | |
Socialist Alliance | Jeannie Robinson | 437 | 1.0 | New | |
Socialist Labour | Bill Harrison | 295 | 0.7 | New | |
Independent | Christopher Rawson | 184 | 0.4 | New | |
Majority | 2,586 | 5.8 | N/A | ||
Turnout | 44,441 | 60.7 | -10.2 | ||
Liberal Democrats gain from Labour | Swing | +8.6 | |||
Party | Candidate | Votes | % | ±% | |
---|---|---|---|---|---|
Labour | Tony Benn | 26,105 | 50.8 | +3.5 | |
Liberal Democrats | Anthony Rogers | 20,330 | 39.6 | +3.8 | |
Conservative | Martin Potter | 4,752 | 9.2 | -7.7 | |
Independent | Norman Scarth | 202 | 0.4 | New | |
Majority | 5,775 | 11.2 | −0.3 | ||
Turnout | 51,389 | 70.9 | −7.2 | ||
Labour hold | Swing | -0.1 | |||
Party | Candidate | Votes | % | ±% | |
---|---|---|---|---|---|
Labour | Tony Benn | 26,461 | 47.3 | +2.4 | |
Liberal Democrats | Anthony Rogers | 20,047 | 35.8 | +6.2 | |
Conservative | PG Lewis | 9,473 | 16.9 | −8.1 | |
Majority | 6,414 | 11.5 | −3.8 | ||
Turnout | 55,981 | 78.1 | +1.4 | ||
Labour hold | Swing | -1.9 | |||
Party | Candidate | Votes | % | ±% | |
---|---|---|---|---|---|
Labour | Tony Benn | 24,532 | 44.9 | −3.2 | |
Liberal | Anthony Rogers | 15,955 | 29.6 | +10.1 | |
Conservative | Ronald Grant | 13,472 | 25.0 | -7.4 | |
Majority | 8,577 | 15.3 | -0.4 | ||
Turnout | 53,959 | 76.7 | +4.1 | ||
Labour hold | Swing | -6.6 | |||
Party | Candidate | Votes | % | ±% | |
---|---|---|---|---|---|
Labour | Tony Benn | 24,633 | 46.5 | -1.6 | |
Liberal | Max Payne | 18,369 | 34.7 | +15.2 | |
Conservative | Nick Bourne | 8,028 | 15.2 | -17.2 | |
Independent Labour | Bill Maynard | 1,355 | 2.6 | New | |
Monster Raving Loony | Screaming Lord Sutch | 178 | 0.3 | New | |
Independent | David Bentley | 116 | 0.2 | New | |
Independent | John Davey | 83 | 0.2 | New | |
Independent | Thomas Layton | 46 | 0.1 | New | |
Independent | Helen Anscombe | 34 | 0.1 | New | |
Independent | Jitendra Bardwaj | 33 | 0.1 | New | |
Independent | Donald Butler | 24 | 0.1 | New | |
Independent | Paul Nicholls-Jones | 22 | 0.0 | New | |
Independent | Sid Shaw | 20 | 0.0 | New | |
Independent | Christopher Hill | 17 | 0.0 | New | |
Independent | Giancarlo Piccaro | 15 | 0.0 | New | |
Independent | David Cahill | 12 | 0.0 | New | |
Independent | John Connell | 7 | 0.0 | New | |
Majority | 6,264 | 11.8 | -3.9 | ||
Turnout | 52,992 | 76.9 | +4.3 | ||
Labour hold | Swing | -8.4 | |||
Party | Candidate | Votes | % | ±% | |
---|---|---|---|---|---|
Labour | Eric Varley | 23,881 | 48.1 | -9.3 | |
Conservative | Nick Bourne | 16,118 | 32.4 | +0.2 | |
Liberal | Max Payne | 9,705 | 19.5 | +9.1 | |
Majority | 7,763 | 15.7 | -9.5 | ||
Turnout | 49,704 | 72.6 | -0.8 | ||
Labour hold | Swing | -4.75 | |||
Party | Candidate | Votes | % | ±% | |
---|---|---|---|---|---|
Labour | Eric Varley | 31,049 | 57.4 | -2.5 | |
Conservative | S. Hill | 17,445 | 32.2 | +6.3 | |
Liberal | Max Payne | 5,617 | 10.4 | -3.8 | |
Majority | 13,604 | 25.2 | -8.8 | ||
Turnout | 54,111 | 73.4 | +0.8 | ||
Labour hold | Swing | -4.4 | |||
Party | Candidate | Votes | % | ±% | |
---|---|---|---|---|---|
Labour | Eric Varley | 30,953 | 59.9 | +5.1 | |
Conservative | J. D. Taylor | 13,393 | 25.9 | -1.7 | |
Liberal | M. W. Brown | 7,349 | 14.2 | -3.4 | |
Majority | 17,560 | 34.0 | +6.8 | ||
Turnout | 51,695 | 72.6 | -7.5 | ||
Labour hold | Swing | +3.4 | |||
Party | Candidate | Votes | % | ±% | |
---|---|---|---|---|---|
Labour | Eric Varley | 31,040 | 54.8 | -4.2 | |
Conservative | J. D. Taylor | 15,644 | 27.6 | -3.9 | |
Liberal | M. W. Brown | 9,937 | 17.6 | +8.1 | |
Majority | 15,396 | 27.2 | -0.3 | ||
Turnout | 56,621 | 80.1 | +7.7 | ||
Labour hold | Swing | -0.15 | |||
Party | Candidate | Votes | % | ±% | |
---|---|---|---|---|---|
Labour | Eric Varley | 30,386 | 59.0 | -2.6 | |
Conservative | John C Ramsden | 16,217 | 31.5 | +5.2 | |
Liberal | Terence D Bamford | 4,891 | 9.5 | -2.7 | |
Majority | 14,169 | 27.5 | -7.8 | ||
Turnout | 51,494 | 72.4 | -4.3 | ||
Labour hold | Swing | -3.9 | |||
Party | Candidate | Votes | % | ±% | |
---|---|---|---|---|---|
Labour | Eric Varley | 31,542 | 61.6 | +5.1 | |
Conservative | Alan T Hale | 13,443 | 26.3 | -2.4 | |
Liberal | Terence D. Bamford | 6,227 | 12.2 | -2.6 | |
Majority | 18,099 | 35.3 | +7.5 | ||
Turnout | 51,212 | 76.7 | -2.1 | ||
Labour hold | Swing | +3.75 | |||
Party | Candidate | Votes | % | ±% | |
---|---|---|---|---|---|
Labour | Eric Varley | 29,452 | 56.5 | -0.1 | |
Conservative | William G Blake | 14,944 | 28.7 | -3.0 | |
Liberal | Derek A McKie | 7,738 | 14.8 | +3.0 | |
Majority | 14,508 | 27.8 | +2.9 | ||
Turnout | 52,134 | 78.8 | -3.9 | ||
Labour hold | Swing | +1.49 | |||
Party | Candidate | Votes | % | ±% | |
---|---|---|---|---|---|
Labour | George Benson | 30,534 | 56.6 | -1.0 | |
National Liberal | James Anthony Lemkin | 17,084 | 31.7 | -10.7 | |
Liberal | Geoffrey R. Smedley-Stevenson | 6,360 | 11.8 | New | |
Majority | 13,450 | 24.9 | +9.6 | ||
Turnout | 53,978 | 82.7 | +2.8 | ||
Labour hold | Swing | +4.85 | |||
Party | Candidate | Votes | % | ±% | |
---|---|---|---|---|---|
Labour | George Benson | 29,602 | 57.7 | -6.0 | |
National Liberal | Frank Hadfield | 21,748 | 42.4 | +6.1 | |
Majority | 7,854 | 15.3 | -12.1 | ||
Turnout | 51,350 | 79.9 | -4.3 | ||
Labour hold | Swing | -6.05 | |||
Party | Candidate | Votes | % | ±% | |
---|---|---|---|---|---|
Labour | George Benson | 34,753 | 63.7 | +2.9 | |
National Liberal | John F. Nash | 19,776 | 36.3 | +5.4 | |
Majority | 14,977 | 27.4 | -2.5 | ||
Turnout | 54,529 | 84.2 | -2.8 | ||
Labour hold | Swing | +1.25 | |||
Party | Candidate | Votes | % | ±% | |
---|---|---|---|---|---|
Labour | George Benson | 33,914 | 60.8 | -2.0 | |
National Liberal | Andrew Cavendish | 17,231 | 30.9 | -6.3 | |
Liberal | John William O'Neill | 4,052 | 7.3 | New | |
Communist | Bas Barker [30] | 554 | 1.0 | New | |
Majority | 16,683 | 29.9 | +4.2 | ||
Turnout | 55,751 | 87.0 | +9.6 | ||
Labour hold | Swing | +2.15 | |||
Party | Candidate | Votes | % | ±% | |
---|---|---|---|---|---|
Labour | George Benson | 29,459 | 62.8 | +11.9 | |
Conservative | Andrew Cavendish | 17,424 | 37.2 | -2.1 | |
Majority | 12,035 | 25.6 | +14.0 | ||
Turnout | 46,883 | 77.4 | -2.4 | ||
Labour hold | Swing | +7.0 | |||
General Election 1939–40:
Another general election was required to take place before the end of 1940. The political parties had been making preparations for an election to take place from 1939 and by the end of this year, the following candidates had been selected; *Labour: George Benson,
Party | Candidate | Votes | % | ±% | |
---|---|---|---|---|---|
Labour | George Benson | 21,439 | 50.94 | ||
Conservative | Roger Conant | 16,555 | 39.33 | ||
Liberal | Robert George Hill | 4,096 | 9.73 | New | |
Majority | 4,884 | 11.61 | N/A | ||
Turnout | 40,072 | 79.78 | |||
Labour gain from Conservative | Swing | ||||
Party | Candidate | Votes | % | ±% | |
---|---|---|---|---|---|
Conservative | Roger Conant | 23,026 | 57.46 | ||
Labour | George Benson | 17,046 | 42.54 | ||
Majority | 5,980 | 14.92 | N/A | ||
Turnout | 40,072 | 80.02 | |||
Conservative gain from Labour | Swing | ||||
Party | Candidate | Votes | % | ±% | |
---|---|---|---|---|---|
Labour | George Benson | 20,296 | 54.1 | +14.4 | |
Unionist | Roger Conant | 9,915 | 26.4 | New | |
Liberal | Harry Cropper | 7,329 | 19.5 | −40.8 | |
Majority | 10,381 | 27.7 | N/A | ||
Turnout | 37,540 | 77.8 | +13.4 | ||
Registered electors | 48,278 | ||||
Labour gain from Liberal | Swing | +27.6 | |||
Party | Candidate | Votes | % | ±% | |
---|---|---|---|---|---|
Liberal | Barnet Kenyon | 13,971 | 60.3 | +9.4 | |
Labour | George Benson | 9,206 | 39.7 | +13.8 | |
Majority | 4,765 | 20.6 | −4.4 | ||
Turnout | 23,177 | 64.4 | −4.6 | ||
Registered electors | 35,989 | ||||
Liberal hold | Swing | −2.2 | |||
Party | Candidate | Votes | % | ±% | |
---|---|---|---|---|---|
Liberal | Barnet Kenyon | 12,164 | 50.9 | N/A | |
Labour | George Benson | 6,198 | 25.9 | New | |
Unionist | R F H Broomhead-Colton-Fox | 5,541 | 23.2 | New | |
Majority | 5,966 | 25.0 | N/A | ||
Turnout | 23,903 | 69.0 | N/A | ||
Registered electors | 34,648 | ||||
Liberal hold | Swing | N/A | |||
Party | Candidate | Votes | % | ±% | |
---|---|---|---|---|---|
Liberal | Barnet Kenyon | Unopposed | |||
Liberal hold | |||||
Party | Candidate | Votes | % | ±% | |
---|---|---|---|---|---|
Liberal | Barnet Kenyon | Unopposed | |||
Liberal gain from Labour |
Party | Candidate | Votes | % | ±% | |
---|---|---|---|---|---|
Lib-Lab | Barnet Kenyon | 7,725 | 55.8 | −3.2 | |
Unionist | Edward Christie | 5,539 | 40.0 | −1.0 | |
Independent Labour | John Scurr | 583 | 4.2 | New | |
Majority | 2,186 | 15.8 | −2.2 | ||
Turnout | 13,847 | 81.5 | +5.6 | ||
Registered electors | 16,995 | ||||
Lib-Lab hold | Swing | −1.1 | |||
Party | Candidate | Votes | % | ±% | |
---|---|---|---|---|---|
Labour | James Haslam | 7,283 | 59.0 | −0.1 | |
Conservative | W.G.W. Radford | 5,055 | 41.0 | +0.1 | |
Majority | 2,228 | 18.0 | −0.2 | ||
Turnout | 12,338 | 75.9 | −9.8 | ||
Registered electors | 16,248 | ||||
Labour hold | Swing | −0.1 | |||
Party | Candidate | Votes | % | ±% | |
---|---|---|---|---|---|
Labour | James Haslam | 8,234 | 59.1 | +2.6 | |
Conservative | W.G.W. Radford | 5,693 | 40.9 | −2.6 | |
Majority | 2,541 | 18.2 | +5.2 | ||
Turnout | 13,927 | 85.7 | +0.5 | ||
Registered electors | 16,248 | ||||
Labour hold | Swing | +2.6 | |||
Party | Candidate | Votes | % | ±% | |
---|---|---|---|---|---|
Lib-Lab | James Haslam | 7,254 | 56.5 | +3.1 | |
Conservative | Godfrey Locker-Lampson | 5,590 | 43.5 | −3.1 | |
Majority | 1,664 | 13.0 | +6.2 | ||
Turnout | 12,844 | 85.2 | +1.1 | ||
Registered electors | 15,077 | ||||
Lib-Lab hold | Swing | +3.1 | |||
Party | Candidate | Votes | % | ±% | |
---|---|---|---|---|---|
Liberal | Thomas Bayley | 5,418 | 53.4 | +2.0 | |
Conservative | A. W. Byron | 4,729 | 46.6 | −2.0 | |
Majority | 689 | 6.8 | +4.0 | ||
Turnout | 10,147 | 84.1 | −1.3 | ||
Registered electors | 12,069 | ||||
Liberal hold | Swing | +2.0 | |||
Party | Candidate | Votes | % | ±% | |
---|---|---|---|---|---|
Liberal | Thomas Bayley | 4,572 | 51.4 | +0.3 | |
Conservative | A. W. Byron | 4,325 | 48.6 | −0.3 | |
Majority | 247 | 2.8 | +0.6 | ||
Turnout | 8,897 | 85.4 | +4.8 | ||
Registered electors | 10,413 | ||||
Liberal hold | Swing | +0.3 | |||
Party | Candidate | Votes | % | ±% | |
---|---|---|---|---|---|
Liberal | Thomas Bayley | 4,249 | 51.1 | +1.9 | |
Liberal Unionist | Alfred Barnes | 4,067 | 48.9 | −1.9 | |
Majority | 182 | 2.2 | N/A | ||
Turnout | 8,316 | 80.6 | −0.9 | ||
Registered electors | 10,313 | ||||
Liberal gain from Liberal Unionist | Swing | +1.9 | |||
Party | Candidate | Votes | % | ±% | |
---|---|---|---|---|---|
Liberal Unionist | Alfred Barnes | 3,567 | 50.8 | +22.1 | |
Liberal | Thomas Bayley | 3,453 | 49.2 | +3.5 | |
Majority | 114 | 1.6 | N/A | ||
Turnout | 7,020 | 81.5 | −5.0 | ||
Registered electors | 8,616 | ||||
Liberal Unionist gain from Liberal | Swing | +9.3 | |||
Party | Candidate | Votes | % | ±% | |
---|---|---|---|---|---|
Liberal | Alfred Barnes | 3,408 | 45.7 | ||
Conservative | John Cumming Macdona | 2,136 | 28.7 | ||
Independent Liberal-Labour | James Haslam | 1,907 | 25.6 | ||
Majority | 1,272 | 17.0 | |||
Turnout | 7,451 | 86.5 | |||
Registered electors | 8,616 | ||||
Liberal win (new seat) |
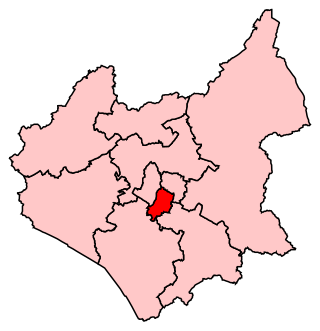
Leicester South is a constituency, recreated in 1974, represented in the House of Commons of the UK Parliament since 2011 by Jonathan Ashworth of the Labour Co-op Party. A previous version of the seat existed between 1918 and 1950. Except for a 2004 by-election when it was won by the Liberal Democrats, Leicester South has been held by the Labour Party since 1987.
Cheadle is a borough constituency represented in the House of Commons of the Parliament of the United Kingdom.
Liverpool, West Derby is a constituency represented in the House of Commons of the UK Parliament since 2019 by Ian Byrne of the Labour Party.
Amber Valley is a constituency in Derbyshire, represented in the House of Commons of the UK Parliament since 2010 by Nigel Mills, a Conservative.
Ashfield is a constituency represented in the House of Commons of the UK Parliament by Lee Anderson, formerly of the Conservative Party, but who had the whip suspended in February 2024 and two weeks later joined Reform UK to become their first MP.
Makerfield is a constituency represented in the House of Commons of the UK Parliament the seat is currently empty due to the dissalution of parliament.
Liverpool Garston was a borough constituency represented in the House of Commons of the Parliament of the United Kingdom which existed from 1950 and 2010. It elected one Member of Parliament (MP) by the first past the post system of election.
Liverpool Wavertree is a borough constituency of the Parliament of the United Kingdom. It was created in 1997 and every election since has been won by a Labour Party candidate.
St. Helens North is a constituency created in 1983 represented in the House of Commons of the UK Parliament since 2015 by the Labour Party's Conor McGinn, Shadow Minister without Portfolio from 4 December 2021. Between 1997 and 2015 the MP was Labour's David Watts.
Southport is a constituency in Merseyside which has been represented in the House of Commons of the UK Parliament since 2017 by Damien Moore of the Conservative Party.
Brighton Kemptown is a constituency represented in the House of Commons of the UK Parliament since 2017 by Lloyd Russell-Moyle, an Independent, after being suspended by the Labour Party in May 2024. The seat is often referred to as Brighton Kemptown and Peacehaven by local political parties, and will formally adopt that name following the 2024 general election.
Derby North is a constituency formed of part of the city of Derby, represented in the House of Commons of the UK Parliament since 2019 by Amanda Solloway, a Conservative.
Derby South is a constituency formed of part of the city of Derby represented in the House of Commons of the UK Parliament since 1983 by veteran MP Margaret Beckett of the Labour Party. She has served under the Labour governments of Harold Wilson, James Callaghan, Tony Blair and Gordon Brown. She became interim Leader of the Labour Party in 1994 when John Smith suddenly died. She has also served under Neil Kinnock and Smith himself.
North East Derbyshire is a constituency created in 1885 represented in the House of Commons of the UK Parliament since 2017 by Lee Rowley of the Conservative Party. This was the first time a Conservative candidate had been elected since 1935.
Stoke-on-Trent South is a constituency created in 1950, and represented in the House of Commons of the UK Parliament since 2017 by Jack Brereton, a Conservative. The local electorate returned a Labour MP in every election until 2017, when Brereton became its first Conservative MP. The seat is non-rural and in the upper valley of the Trent covering half of the main city of the Potteries, a major ceramics centre since the 17th century.
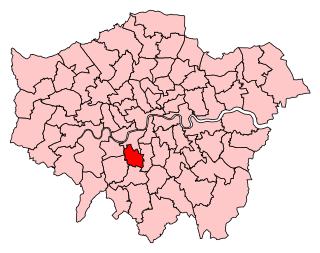
Tooting is a constituency created in 1974 in Greater London. It is represented in the House of Commons of the UK Parliament since 2016 by Dr. Rosena Allin-Khan, a member of the Labour Party.
Greenwich and Woolwich is a constituency represented in the House of Commons of the UK Parliament since 2015 by Matthew Pennycook of the Labour Party.
Hove is a borough constituency in East Sussex represented in the House of Commons of the UK Parliament since 2015 by Peter Kyle on behalf of the Labour Party.
Derbyshire Dales is a constituency that has been represented in the House of Commons of the UK Parliament since 2019 by Sarah Dines of the Conservative Party. The constituency was created for the 2010 general election.
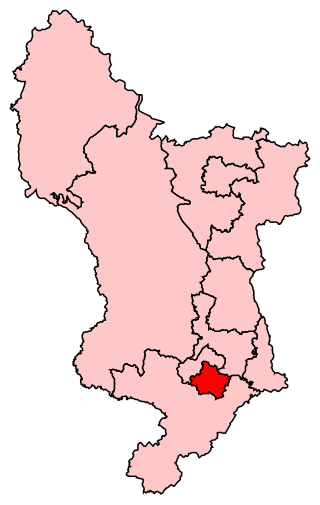
Mid Derbyshire is a constituency represented in the House of Commons of the UK Parliament since its 2010 creation by Pauline Latham, a Conservative.